Sorghum’s natural characteristics and compatibility with organic farming principles indeed make it an excellent crop for organic cultivation. While some traits like drought tolerance and non-GMO status are shared with conventional sorghum, these characteristics synergize particularly well with the goals and methods of organic agriculture, offering distinct advantages.
Click a link below to scroll down!
Post Updated 3/27/26
- Sorghum’s Advantages
- Buying seed?
- Sorghum Varieties
- Forage Sorghum Varieties
- Sorghum Sudan Grass Varieties
- Sorghum Seed Companies
- Other Resources (just click to see)
Sorghum’s Advantages
- Drought Tolerance: Sorghum’s inherent drought tolerance makes it an ideal crop for organic systems, which prioritize water conservation and efficient use.
- Low Fertilizer Needs: Sorghum’s ability to thrive in less fertile soils matches well with organic farming, which relies on natural fertility management rather than synthetic fertilizers.
- Natural Resistance to Pests and Diseases: Sorghum’s inherent resistance to many pests and diseases minimizes the need for synthetic pesticides, making it easier for organic farmers to manage their crops.
- Versatility in Use: Sorghum can be utilized in a variety of ways (grain, syrup, fodder) which allows organic producers to cater to diverse markets (food, feed, sweeteners) under organic labels.
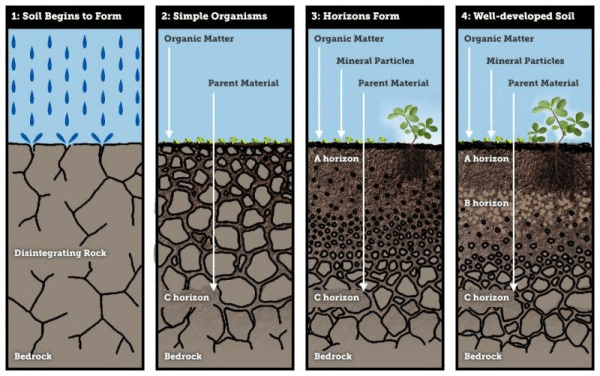
- Contribution to Soil Health: Sorghum’s deep rooting system can improve soil structure and increase water infiltration, beneficial effects that are particularly valued in organic systems focused on long-term soil health.
- Crop Rotation and Diversity: Sorghum fits well into crop rotations, a cornerstone of organic farming, helping break pest and disease cycles and improving soil health without relying on chemical inputs.
- Consumer Preference for Non-GMO: Even though there is no GMO sorghum on the market, the strong consumer preference for non-GMO products benefits organic sorghum producers, as their products are guaranteed to meet this demand.
- Growing Demand for Organic Grains: The increasing consumer demand for organic products extends to grains, including sorghum, for both human consumption and organic animal feed.
- Carbon Sequestration: Sorghum’s growth habit and biomass production can contribute to carbon sequestration, aligning with the environmental sustainability goals of organic farming.
While many of sorghum’s traits benefit both conventional and organic systems, its natural resilience, low input requirements, and versatility make it particularly well-suited for organic agriculture. These characteristics help organic sorghum producers minimize reliance on external inputs, align with organic principles, and tap into a growing market demand for organic products.
Buying seed?
The number of seeds per pound in sorghum varieties can vary significantly depending on the specific variety and the size of the seeds. Generally, this range can be broad, reflecting differences in genetics, breeding objectives, and end use (grain, forage, or specialty types). Here’s a general overview:
- Small-Seeded Varieties: Can have as many as 16,000 to 18,000 seeds per pound.
- Large-Seeded Varieties: May have fewer seeds per pound, typically ranging from 12,000 to 15,000 seeds per pound.
- Forage sorghums and sorghum-sudangrass hybrid types tend to have larger seeds compared to grain sorghum varieties. The seeds per pound can range from 10,000 to 14,000 for forage types, with sorghum-sudangrass hybrids often on the lower end of this scale due to their larger seed size.
Sorghum Varieties
The varieties listed below are some planted by current organic growers. We are in the process of getting a better list together and will post them here!
These varieties are listed along with their respective websites for more detailed information. Company listings are down below and your source for qualified salespeople. Check with your certifier before buying any sorghum seed especially if the variety is not sold as organically produced. Since we do not have many organic, locally adapted sorghum varieties producers typically buy conventionally produced varieties without seed treatments.
- Frontier F305C, F-279: Products (frontierhybrids.com)
- GW-1160: GW Sorghum Seed Co. Inc. – Sorghum Seed Producers
- Sorghum Partners 43M80: SP 43M80 – sorghumpartners.com
- BH Genetics 3701, and 4220 – grain sorghum: https://bhgenetics.com/
BH Genetics has non-GMO and untreated sorghum and corn seed available for organic growers. To check out the list: BH Genetics Untreated Seed List
Forage Sorghum Varieties
- BH Genetics – Pearl https://bhgenetics.com/
- Mojo Seed – Pearl, Opal (silage hybrid): https://mojoseed.com/
Sorghum Sudan Grass Varieties
- Organic BMR sorghum sudangrass S72: Richardson Seed Company
- (Hybrid) Trudan Headless: Trudan Headless – S&W Seed Co
- BH 1475: BH Genetics
Sorghum Seed Companies
Richardson Seeds
- PO Box 60, Vega, TX 79092
- Office: 806-767-4486
- David Drinnon
- Mobile: 806-683-7448
- David@richardsonseeds.com
- Jarrod Cook
- jarrod@richardsonseeds.com
DynaGro Seed (Nutrien Ag Solutions)
- Nutrien Ag Solutions, Coastal Plains Division, 303 Arguello, College Staton TX 77840
- Website: NutrienAgSolutions.com and DynaGroSeed.com
- Email: James.willms@nutrien.com
- Phone: 361-960-4399
MOJO Seed
- PO Box 1716, Hereford, TX 79045
- Jerry O’Rear
- Mobile: 806-445-6442
- jerryorear1@gmail.com or jerry@mojoseed.com
Sorghum Partners, S&W Seed Company
- 2101 Ken Pratt Blvd. Suite 201, Longmont, CO 80501
- Scott Staggenborg
- Mobile: 785-313-3115
- scottstaggenborg@swseedco.com
Scott Seed Co
- 114 E New York St. or PO Box 1732, Hereford, TX 79045
- Office: 806-364-3484
- Coby Kreighauser
- Mobile: 806-683-1868
- coby@scottseed.net
- Chuck Cielencki
- Mobile: 806-683-1868
- chuck@scottseed.net
Supra Ag International
- 10808 S River Front Pkwy, Suite 3039, South Jordan, UT 84095
- Office: 801-984-6723
- Sales: 806-292-0031
- info@supra.ag
- Chris Hendrickson
- chris@supra.ag
Warner Seeds
- PO Box 1877, Hereford, TX 79045
- Cheb Krueger
- Mobile: 806-364-4470
- ckrueger@warnerseeds.com
Integra, Wilbur-Ellis
- David Ferrell
- 123 Champions Ct., Georgetown, TX 78628
- Mobile: 662-671-9004
- dferrell@wilberellis.com
- George LeGrande
- glegrande@wilburellis.com
LG Seeds
- 1122 E 169th Street, Westfield, IN 46074
- Jorge Guzman
- 1212 E Jackson Ave., Phar, TX 78577
- Mobile: 956-603-7133
- jorge.guzman@lgseeds.com
- Denver Cole
- Mobile: 254-405-0539
- Denver.Cole@lgseeds.com
- Matt Teply
- Mobile: 308-883-0515
- matt.teply@lgseeds.com
Golden Acres
- Chris Sheppard
- chris.sheppard@goldenacres.com
Innvictis Seed Solutions
- 1803 Laura Ln., College Station, TX 77840
- Max Crittenden
- Mobile: 542-652-0032
- max.crittenden@innvictis.com
Alta Seeds by Advanta
- Leana Garretson
- Lena.Garrison@advantaseeds.com
DeKalb (Bayer)
- No current varieties untreated!
- PO Box 433, Sunray, TX 79086
- Kagan Randolph
- Mobile: 806-338-1751
- kagan.randolph@bayer.com
- Scott Stanislav
- 800 N. Lindbergh St., Louis, MO 63141
- Mobile: 573-253-4962
- scott.stanislav@bayer.com
BH Genetics
- 5933 Fm 1157, Ganado, TX 77962
- Office: (361) 771-2755
- Website: https://bhgenetics.com/
- Bart Hajovsky
- Mobile: (361) 771-5522
- Email: bart@bhgenetics.com
Other Resources (just click to see)
- 2024 AgriLife Sorghum Silage Trial Tables (Excel Spreadsheets)
- 2024 AgriLife Forage Sorghum Silage Trial
- TAMU Silage Variety Trial Results
- TAMU Grain Sorghum Variety Trial Results
- Managing Insect and Mite Pests of Texas Sorghum (not organic but excellent info)
- What is the True Cost of Compost (or manure) in 2024?
- Soil Testing, soil results, soil test labs
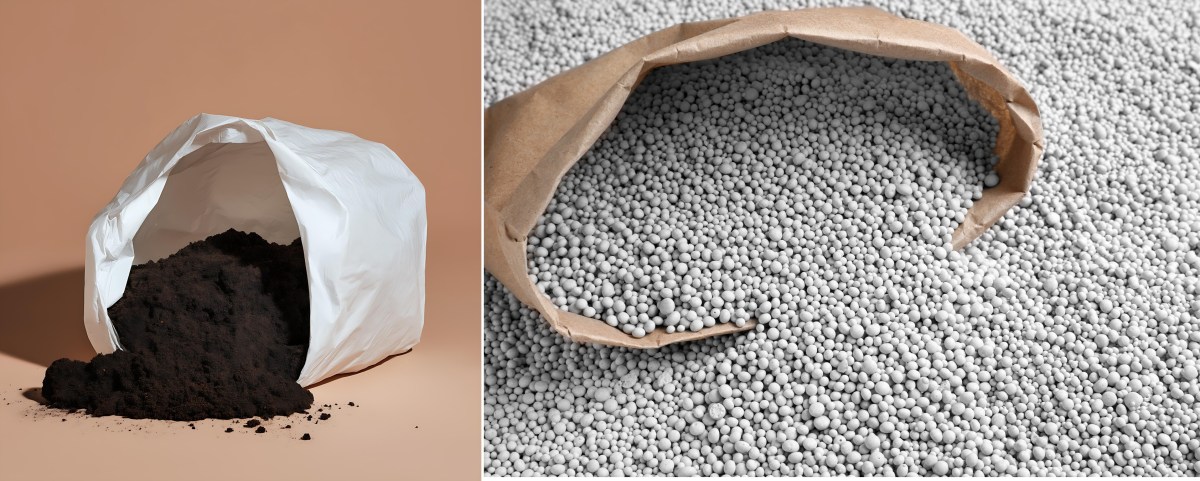
- Organic Fertilizer – what is it, what are the rules, and where do you buy it?
- Organic Materials/Products Lists
- Organic Weed Control
- Best Cover Crops for Weed Control and Fertility
- Allelopathy – What is it, what has it, and how do we use it?
- Organic Seed May Soon Be Required