New Organic Import Codes: Why Better Trade Data Matters to Organic Farmers

New organic-specific import codes will improve tracking of organic products entering the United States, giving farmers, handlers and policymakers better information about trade volumes, origins and market competition.

The U.S. International Trade Commission has added 29 new organic-specific Harmonized Tariff Schedule (HTS) codes for products imported into the United States. While HTS codes may sound like a technical customs issue, this change is important for organic importers, handlers and anyone trying to better understand organic markets.

HTS codes are the numbers used by U.S. Customs and Border Protection to classify products entering the United States. When an organic-specific HTS code exists for a product, that organic code must be used for the import filing. Exporters also use the appropriate organic HTS code when requesting the USDA National Organic Program Import Certificate associated with the shipment. (CCOF)

What Changed July 1, 2026?

Beginning July 1, 2026, USDA changed the filing status for 29 organic HTS codes from optional filing to required filing in the Customs and Border Protection Automated Commercial Environment, commonly called ACE. (U.S. Customs and Border Protection)

The new organic classifications cover a surprisingly broad group of products, including:

  • Brussels sprouts and frozen vegetable mixtures
  • Hemp seed and other oilseeds
  • Plant materials and vegetable extracts
  • Avocado oil and other vegetable oils
  • Sugars
  • Cocoa powder, chocolate and other cocoa products
  • Pasta and cereal products
  • Biscuits and other baked products
  • Orange, berry and mixed fruit juices
  • Soups and broths
  • Other prepared foods
  • Vodka, tequila and vinegar

The number of processed foods on the list is noteworthy. Organic trade tracking is increasingly moving beyond basic agricultural commodities and into the ingredients and finished products that make up today’s organic food supply chain.

Why Does This Matter?

One of the continuing challenges in understanding organic markets is determining how much organic product is actually entering the United States.

When an organic product has no organic-specific HTS classification, it can be difficult to separate organic trade from conventional trade using traditional customs statistics. Creating additional organic-specific codes allows imports to be identified more precisely by commodity.

That improves our ability to answer some important market questions:

How much organic product is being imported? Where is it coming from? Is import volume increasing or decreasing? What products are competing with U.S.-produced organic products?

For producers, handlers, researchers and policymakers, better trade data means a better picture of what is actually happening in the organic marketplace.

Organic HTS Codes and the NOP Import Certificate

The HTS codes also work together with another major change in organic import oversight: the electronic NOP Import Certificate.

Since March 19, 2024, each shipment of certified organic agricultural products imported into the United States must be associated with an NOP Import Certificate issued by an accredited certifying agent through USDA’s Organic INTEGRITY Database. USDA states that one NOP Import Certificate is issued per commodity/product or HTS code. (USDA Agricultural Marketing Service)
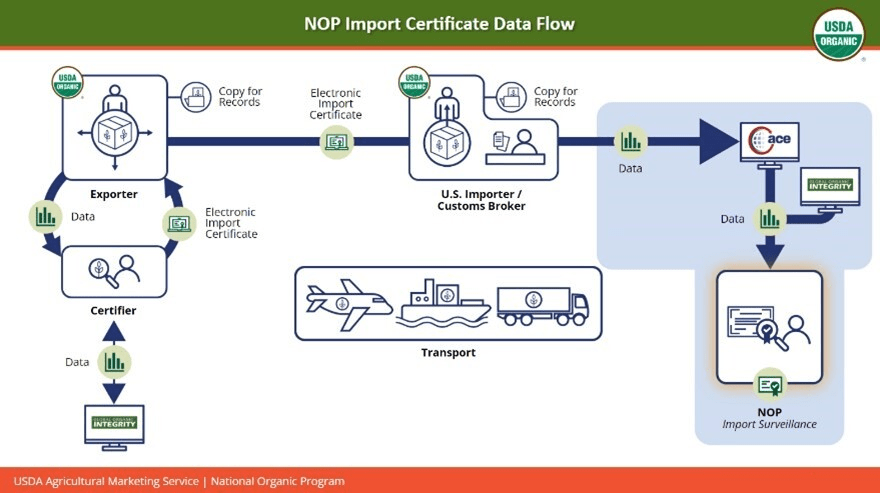
That creates an important connection between organic certification and customs information:

NOP Import Certificate → verifies the organic shipment

Organic HTS Code → identifies the organic product entering the country

Together, these systems provide USDA and Customs and Border Protection with better tools for traceability, enforcement and market information.

An Important Point for Organic Handlers and Importers

U.S. Customs and Border Protection warns that organic shipments arriving without a valid NOP Import Certificate number can be subject to re-export, restricted donation or destruction. Shipments with incorrect or nonconforming certificate information may also receive additional scrutiny or be rejected. (U.S. Customs and Border Protection)

For handlers importing organic products, this makes correct product classification increasingly important. Importers should make certain that their customs broker is using the correct organic HTS code when one exists and that the HTS information agrees with the NOP Import Certificate.

Better Information for the Organic Marketplace

Twenty-nine additional organic trade classifications will not answer every question about organic imports, but they are another important step toward making the organic supply chain more transparent.

For those of us trying to understand organic markets, that is particularly valuable. Instead of simply hearing that “imports are increasing,” better organic-specific trade data can help us determine which products are entering the United States, how much is entering and where those products originate.

That is information both organic farmers and organic handlers can use.

More Resources

2026 Organic Cotton Market Summary

U.S. organic cotton production held nearly steady in 2025, while stronger Pima opportunities, lighter demand and global competition are beginning to reshape planting decisions for Texas growers.

Production Holds Steady, but the Market Is Shifting

USDA Agricultural Marketing Service has released its 2026 Organic Cotton Market Summary for the 2025 marketing year, and this year’s report tells a somewhat different story than the one we saw a year ago.

Last year’s report showed a substantial rebound in U.S. organic cotton production, with the 2024 crop reaching 56,717 bales, an increase of more than 17,000 bales from 2023.

For 2025, production increased again—but only slightly.

Organic Cotton Production

U.S. production of organic Upland and American Pima cotton totaled 57,802 bales in 2025, an increase of just 1,085 bales, or about 1.9%, from 2024.

An additional 1,015 bales of transitional cotton were reported, down from 1,201 bales the previous year.

Texas continues to lead the nation in organic cotton planting and production, with additional organic acreage in Arizona, California and New Mexico.

The production numbers are important because they suggest that the large rebound we saw in 2024 did not continue at the same pace. Organic cotton production essentially leveled off in 2025.

Organic Cottonseed Remains Valuable

Organic cottonseed continues to be an important part of the value of the crop.

USDA reported organic cottonseed prices ranging from $385 to $660 per ton, compared with only $215 to $350 per ton for conventional cottonseed. Cottonseed yields ranged from 500 to 897 pounds of seed per bale of lint.

Most organic cottonseed continues to move into the organic dairy industry, with smaller amounts retained for oil production and livestock feed.

That relationship between Texas organic cotton and organic dairy remains important. Cotton is not simply producing lint for the textile market; the seed is also supplying a valuable certified organic livestock feed ingredient.

The 2026 Crop May Be Telling Us More About the Market

For me, the most interesting part of this year’s report may actually be USDA’s comments about the 2026 crop outlook.

Timely August rainfall helped relieve heat stress, although some fields were lost to hail and excessive heat. USDA also reports that overall organic cotton acreage was lower, in part because of crop rotations.

But one sentence especially stands out:

“Organic Upland acreage declined as growers shifted toward stronger organic Pima contract opportunities.”

USDA also reports that organic cotton demand remains “light amid strong global competition.”

Those two statements probably tell us more about the current organic cotton market than the modest increase in 2025 production.

Growers respond to markets. If contracts and premiums are stronger for organic Pima cotton than for organic Upland cotton, acreage will naturally begin moving in that direction where production conditions allow it.

At the same time, continued global competition is putting pressure on the U.S. organic cotton market.

My Take

A year ago, the big story was the recovery in organic cotton production. This year, I think the story is stability combined with change underneath the numbers.

Production increased from 56,717 to 57,802 bales, but that is essentially a flat year compared with the dramatic increase we saw in 2024. Meanwhile, transitional production declined, organic Upland acreage is reportedly falling, growers are responding to better Pima opportunities, and USDA continues to describe demand as light.

For Texas organic cotton growers, that makes contracts and market signals increasingly important. Producing organic cotton is expensive, especially when we consider weed control, rotations, fertility, seed availability and the additional management required under organic production. Acreage is unlikely to expand simply because organic cotton can be grown. There has to be a market willing to pay for it.

Texas remains the center of U.S. organic cotton production, but where that production goes—Upland versus Pima and perhaps even cotton versus other rotational crops—will increasingly depend on those market opportunities.

More Information

USDA AMS – 2026 Organic Cotton Market Summary
View the August 2026 USDA Organic Cotton Market Summary

Last Year’s Texas A&M AgriLife Organic Summary
2025 Organic Cotton Market Summary

Planning Organic Production with a Practical Price Index

In Extension, we’re often asked to help farmers and food businesses plan for the future—whether it’s transitioning acreage to organic, developing budgets, or evaluating the economics of new practices. One of the most common challenges we face is this: how do you plan for prices in an unpredictable market?

While no one can forecast future prices with certainty, that doesn’t mean we’re flying blind. We base our planning on something measurable, reliable, and rooted in history—and in organic agriculture, one of the most useful tools for this is a broad price index or multiplier.

Why Use a Price Multiplier?

Organic markets—like all markets—fluctuate. Prices are affected by everything from weather and input costs to consumer demand and global trade. But when we look at long-term trends, we begin to see patterns that can inform sound decision-making.

When we have access to strong market data—such as for organic corn, cotton, dairy, and many fruits and vegetables—we can use that data to create benchmarks. These help answer practical questions:

  • What kind of price can I reasonably expect if I go organic?
  • How much more can I budget for input costs and still break even?
  • Will this transition pencil out?

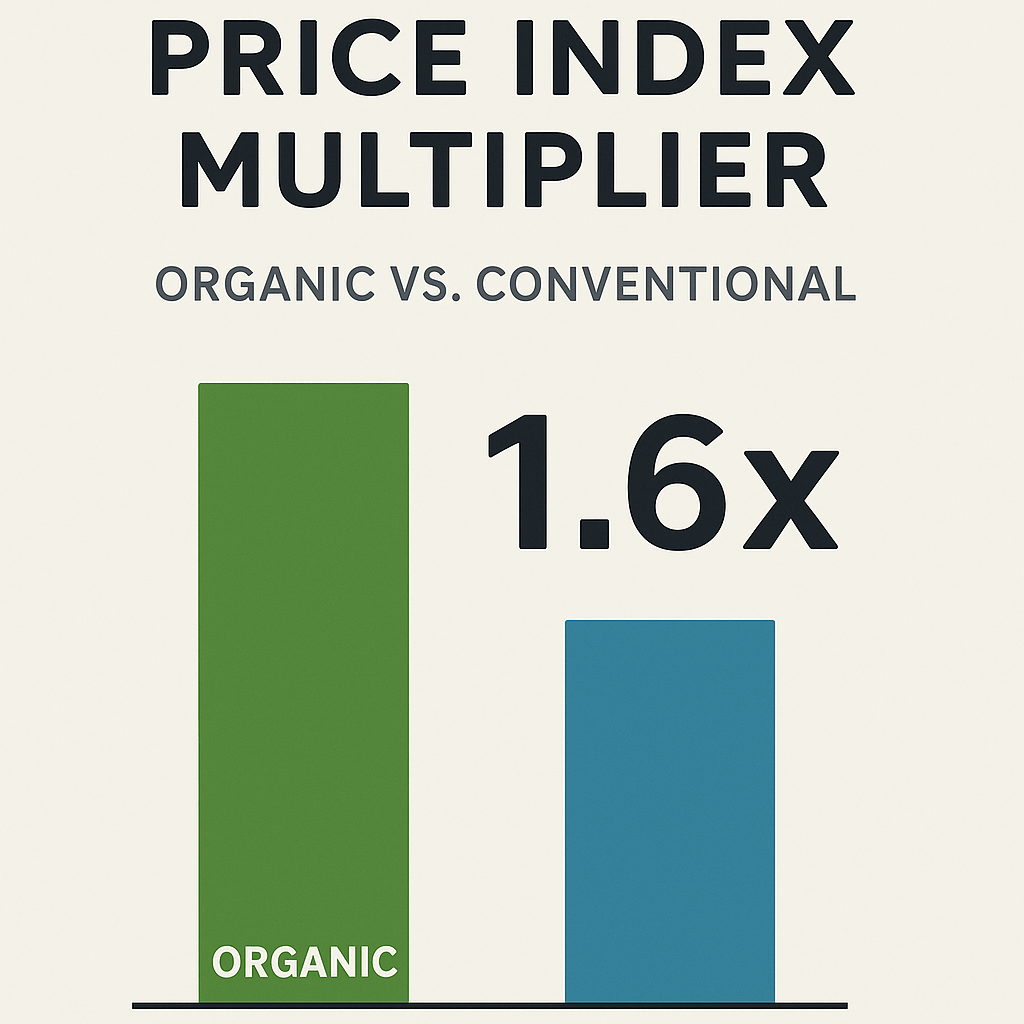
To answer these questions, we need a reference point—and that’s where a 1.6 multiplier comes in.

What Is the 1.6 Organic Multiplier?

The 1.6 multiplier means that organic farmgate prices tend to average about 1.6 times higher than conventional prices for many major commodities over the long run. That’s a 60% premium, based on real market data and USDA price tracking over the past decade or more. I happened to stumble onto this idea when I read an article in Progressive Dairy about conventional milk price forecasts through 2025. (Click to Read) This article made me wonder if I could use historical organic dairy milk prices in relation to conventional dairy milk prices and use this ratio to predict future organic prices. It was amazing to see what I kind of knew, that organic prices do follow with conventional prices for the most part!

So, this is not a guess. It’s backed by:

  • USDA AMS organic market summaries for corn (1.6 is pretty stable for corn) and cotton (less stable as prices have been higher making the index 1.6-2.0 or higher).
  • National organic dairy price reports, which show organic milk regularly selling at 1.5 to 1.65 times the price of conventional.
  • Industry-wide organic vegetable and fruit pricing that shows farmgate premiums in the 1.5 to 1.7 range across categories like tomatoes, lettuce, and apples.

Whether you’re planning production, analyzing risk, or applying for a grant or loan, this index provides a realistic baseline. It is not too optimistic or too pessimistic and is useful for planning purposes.

When This Index Works—and When It Doesn’t

The 1.6 multiplier is a planning tool, not a crystal ball. It works best:

  • When building enterprise budgets for row crops, dairy, and produce.
  • When discussing profitability potential with transitioning farmers.
  • When negotiating contracts or thinking through insurance or risk tools.
  • In extension workshops, to help audiences grasp market potential quickly.

However, this index doesn’t capture every situation. Local sales, direct markets, specialty crops, and extreme weather or supply chain issues can cause premiums to fall below or rise above the average. Sometimes, organic produce in a saturated market may only bring in a 10–20% premium, while other times a rare variety or short supply can push that number above 2x (or higher) the conventional price.

Why It’s Still Useful

Despite those swings, planning requires a number—and the 1.6 index is a solid, evidence-based starting point.

When I help producers set up organic systems, I don’t want to promise the moon. Instead, it is better to offer realistic projections grounded in long-term national trends.

Always I encourage producers to:

  • Adjust their projections up or down depending on crop, region, and market access.
  • Keep checking updated USDA-AMS, Argus Media, or buyer data each year.
  • Use the 1.6x benchmark as a baseline, not a guarantee.

Final Thoughts

As organic agriculture continues to grow, tools like this price index become more and more valuable. They help all of us in organic talk apples to apples with producers, gins, co-ops, lenders, and buyers. They also help demystify what can sometimes feel like a complex or volatile market.

My plan and my job is to keep helping farmers make decisions that are smart, sustainable, and rooted in good data.