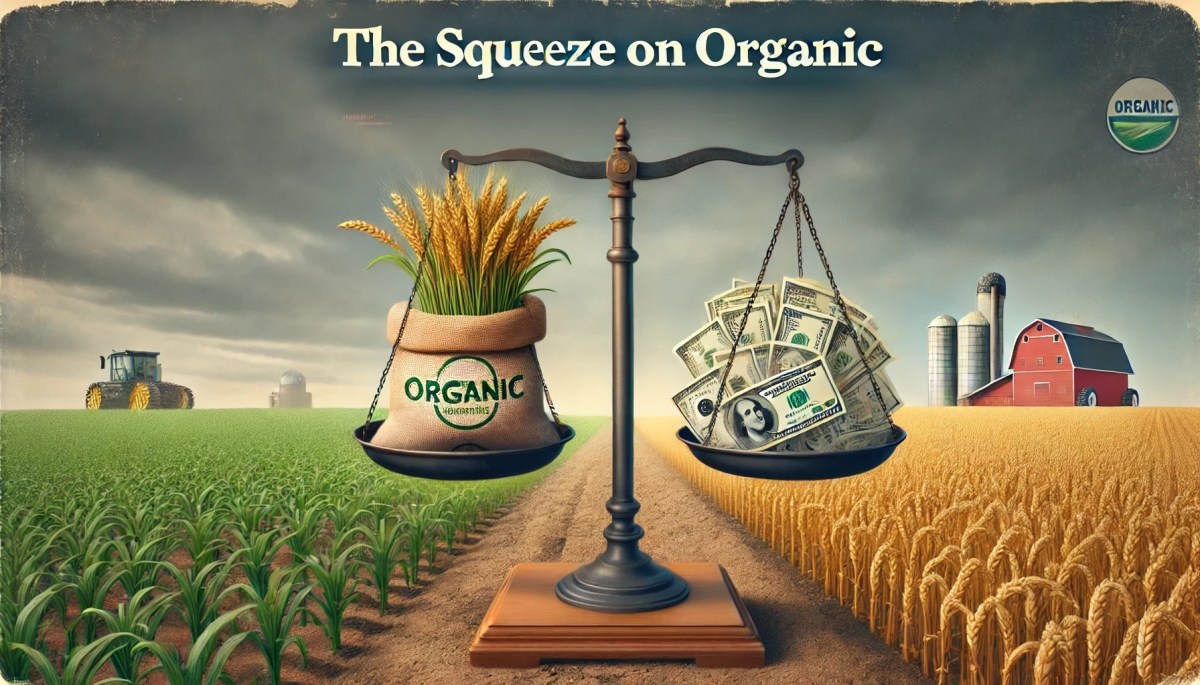
Recent reports indicate a significant downturn in the U.S. organic grain market, with profitability for organic corn, soybean, and wheat farmers reaching record lows. For the 2023-24 marketing year, the combined net returns for these three crops fell to just $42 per acre. The outlook for 2024-25 is even more concerning, with potential negative returns ranging from -$213 to -$277 per acre if current price and cost trends persist. This decline is primarily attributed to plummeting organic commodity prices, with organic soy, corn, and wheat prices down 38-42% from their recent peaks.
The profitability squeeze is particularly severe for organic farmers compared to their conventional counterparts. While both sectors face rising production costs and increased global competition, organic producers are experiencing a “double whammy” of higher costs and lower prices relative to pre-2021 baselines. Conventional grain prices, though down from recent highs, still exceed cost increases when compared to the 2016-2021 period. In contrast, organic corn prices have fallen below historic baselines while production costs have increased. This trend threatens the traditionally higher net returns of organic corn and soybean farming, which have outperformed conventional returns by $12 to $485 per acre over the past eight years.
The declining profitability of organic grain farming raises concerns about farmer retention and the future of organic agriculture in the U.S. It’s estimated that there has been a 5% decrease in the number of organic farmers in 2024 compared to the previous year. Some farmers are considering switching to more profitable organic crops or even reverting to conventional farming. This situation poses a significant challenge to the organic industry and could potentially impact the environmental benefits associated with organic farming practices, including improved water quality and soil health.
Sources include:
Argus Media. “Shrinking profitability of organic farming.” Argus AgriMarkets Organic and Non-GMO service, November 2024.
Grow Well Consulting. “Is the profitability plunge in U.S. organic actually worse than corrections happening in conventional?” October 28, 2024.
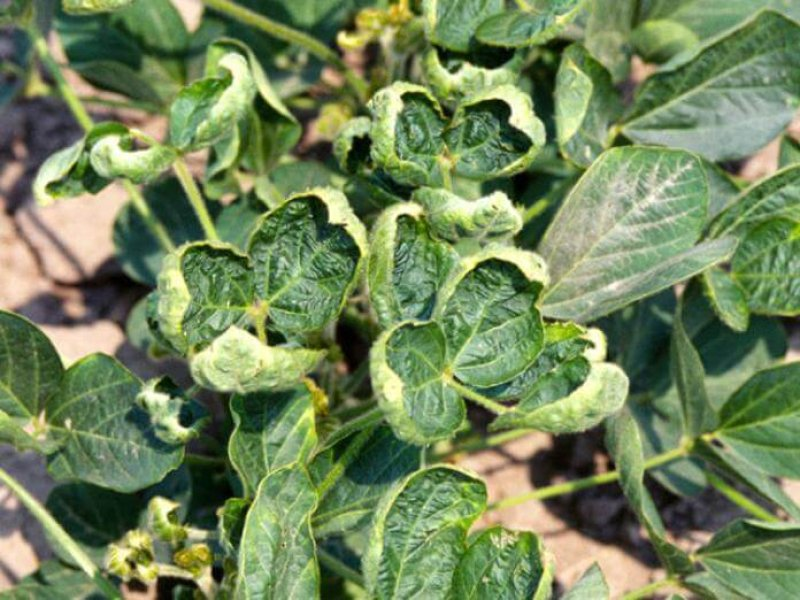
Dicamba, a commonly used herbicide in conventional farming, has long been a point of contention, particularly in regions where organic crops are grown alongside conventional fields. In 2024, the persistence of dicamba drift has become increasingly problematic for organic farmers in West Texas, affecting a range of sensitive crops, particularly cotton and peanuts.
To understand the scale of this issue, I recently conducted a poll targeting 204 organic farmers from Seminole to areas just north of Lubbock. The poll, sent out by email, specifically asked if they had observed dicamba drift on their sensitive crops this year. With a response rate of 27.5% (56 responses), the results are indicative of a widespread concern.
Poll Results: Dicamba Drift on Sensitive Crops
In this poll, farmers were asked a straightforward question: “Have you seen dicamba drift on sensitive crops in 2024?” The results revealed the following breakdown:
50% reported observing dicamba drift on their crops.
44% stated they had not observed drift.
5% mentioned “maybe” they had observed some drift damage.
The responses reflect a troubling level of dicamba exposure, with half of the respondents directly witnessing the impact of drift. While dicamba is designed to target specific weeds, the herbicide’s tendency to volatilize and drift into neighboring fields has made it difficult for organic farmers to avoid its effects, especially in the South Plains.
Impact on Crop Yields
Several farmers shared the tangible impacts dicamba drift has had on their yields. One farmer, who has been practicing organic farming for over three decades, described this year as the “worst dicamba drift in years.” He noted that his soybean yield was cut in half, with probable yield reductions in cotton as well. This problem was bad enough that his comments to me questioned whether it was worth it to keep farming!
The Broader Implications for Organic Farming
The prevalence of dicamba drift has significant ramifications for organic producers in Texas. Yield reductions not only threaten the economic viability of these farmers but also jeopardize their certification status, as organic crops must remain free of prohibited substances. Dicamba drift challenges their ability to meet these requirements, complicating the already demanding task of managing organic systems in a predominantly conventional farming region.
This is just for Awareness
The findings from this poll underscore the need for better management practices to prevent dicamba drift. Organic farmers have invested years into building sustainable systems that meet organic standards, yet their efforts can be undermined by the unintended consequences of a herbicide application on a nearby conventional farm.
Moving forward, it is essential to foster a dialogue between organic and conventional farmers, to find solutions that protect organic crops from unintended herbicide exposure. Additionally, increased awareness and education about the volatility of dicamba and its potential effects on neighboring fields could be critical steps in mitigating drift.
With dicamba products currently off the market, there is growing concern about whether they will be approved for use again in future years. The uncertainty surrounding future approvals adds an additional layer of stress for organic farmers, who are already grappling with the fallout of dicamba drift. Better and more effective safeguards are crucial if dicamba is to return, to ensure that organic farming can continue to thrive without fear of “chemical trespass” on neighboring farms.
What’s Next – FieldWatch offers help
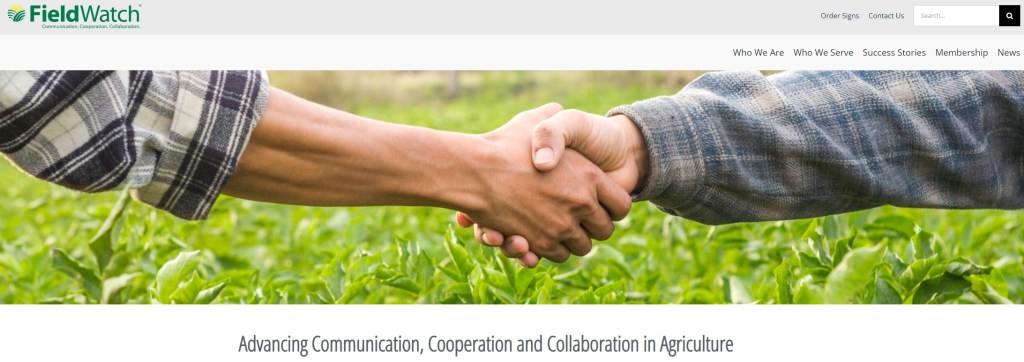
In response to these ongoing challenges posed by any pesticide drift or accidental pesticide application, the Texas Department of Agriculture (TDA) is collaborating with FieldWatch to implement a mapping registry in 2025. This program aims to enhance communication between specialty crop producers, beekeepers, and pesticide applicators, thereby mitigating the risks associated with pesticide drift.
FieldWatch is a non-profit organization that offers free, voluntary mapping tools designed to promote awareness of sensitive sites. By registering their fields, vineyards, orchards and apiaries, producers and beekeepers can inform applicators of locations that require caution during pesticide application. This proactive approach fosters cooperation and helps protect vulnerable crops from unintended exposure.
Texas A&M AgriLife Extension Service will oversee the data management for FieldWatch in Texas, with your Extension Organic Specialist (myself!), serving as the data manager. This collaboration ensures that the registry is maintained with accurate and up-to-date information, facilitating effective communication among all stakeholders.
The introduction of FieldWatch in Texas is a significant step toward protecting organic and specialty crops from pesticide drift. By participating in this registry, farmers can contribute to better use and application of pesticides, ultimately supporting the sustainability of all agriculture in the region.
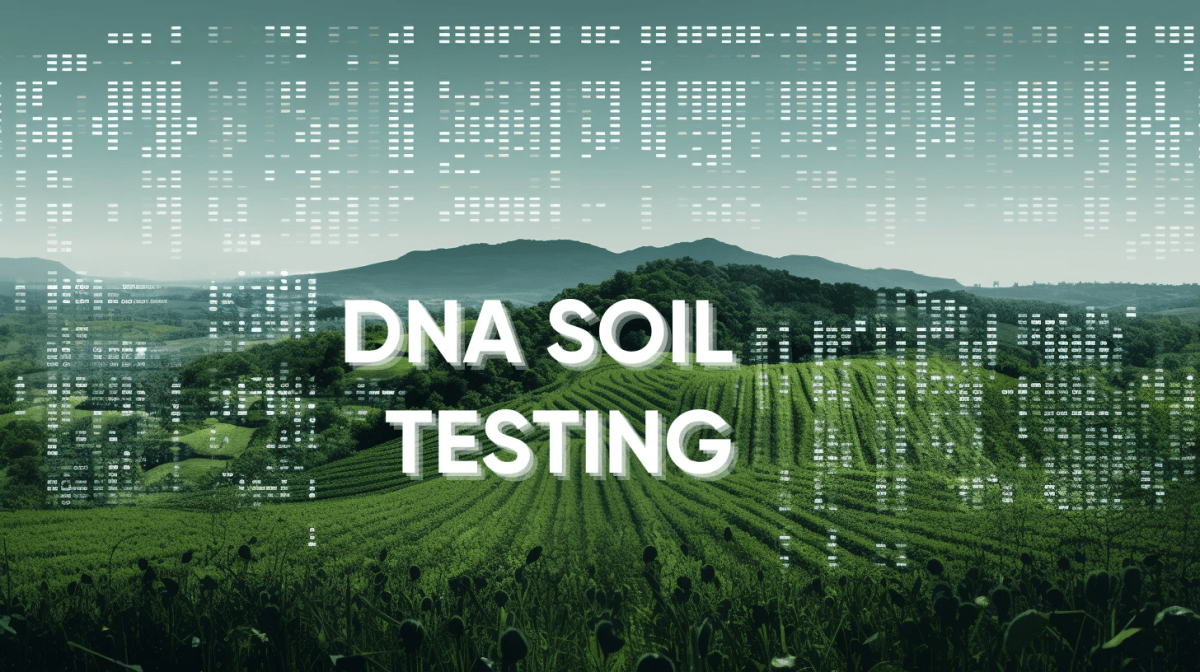
Picture – RhizeBio.com (Decoding Nutrient Availability with DNA Soil Testing for Agriculture)
In recent years, scientific advances in DNA sequencing have allowed us to delve deeper into the hidden world of soil microbiomes—complex ecosystems of bacteria, fungi, and other microorganisms that play a crucial role in soil health. For certified organic farms, where soil vitality is central to crop productivity, DNA testing has become a powerful tool to track the rejuvenation of soil microbial life. Here are several case studies and research examples showing how organic practices can bring “dead” or degraded soils back to life, backed by peer-reviewed studies and long-term trials.
1. Rodale Institute’s Farming Systems Trial (FST)
The Rodale Institute’s Farming Systems Trial (FST) in Pennsylvania, one of the longest-running studies of its kind, has provided compelling evidence on how organic practices restore microbial life in soils. Comparing conventional and organic farming systems, the trial found that organic soils had higher microbial diversity and biomass, which supported better nutrient cycling, drought resilience, and overall soil health. This microbial community improvement was observed within just a few years of organic management.
Seufert, V., Ramankutty, N., & Foley, J. A. (2012). Comparing the yields of organic and conventional agriculture. Nature, 485(7397), 229-232. doi:10.1038/nature11069
2. University of California, Davis – Russell Ranch Sustainable Agriculture Facility
At the Russell Ranch Sustainable Agriculture Facility, part of UC Davis, researchers compared organic and conventional farming systems to understand their impact on soil health. DNA sequencing revealed that organic plots contained a significantly higher abundance of beneficial microbes, such as Actinobacteria and Proteobacteria, which are essential for decomposing organic matter and supplying nutrients to plants. Improvements in microbial diversity were observed within three years, showing how quickly organic management can enhance soil life.
Supporting Study: Bowles, T. M., Acosta-Martínez, V., Calderón, F., & Jackson, L. E. (2014). Soil enzyme activities, microbial communities, and carbon and nitrogen availability in organic agroecosystems across an intensively managed agricultural landscape. Soil Biology and Biochemistry, 68, 252-262. doi:10.1016/j.soilbio.2013.10.004
University of California, Davis. Russell Ranch Sustainable Agriculture Facility. Retrieved from: https://russellranch.ucdavis.edu
3. USDA-ARS Study on Organic Transition in Salinas Valley, California
In California’s Salinas Valley, a USDA-ARS study focused on soil health during the transition from conventional to organic practices. DNA analysis was used to track microbial changes over time, showing that organic practices led to increased populations of beneficial organisms like Pseudomonas (known for disease suppression) and mycorrhizal fungi (which assist in nutrient uptake). Even heavily degraded fields showed signs of microbial recovery within three to five years under organic management.
The graph below illustrates how microbial diversity increased over several years under organic management, similar to what was observed in the USDA-ARS study in the Salinas Valley.
Supporting Study: Schmidt, J. E., Gaudin, A. C. M., & Scow, K. M. (2018). Cover cropping and no-till increase diversity and symbiotrophratios of soil fungal communities. Soil Biology and Biochemistry, 129, 99-109. doi:10.1016/j.soilbio.2018.10.010
USDA Agricultural Research Service (ARS). Organic Agriculture Research and Extension Initiative (OREI). Retrieved from: https://www.ars.usda.gov
4. The DOK Trial in Switzerland (FiBL – Research Institute of Organic Agriculture)
The DOK trial in Switzerland, a long-term study by the Research Institute of Organic Agriculture (FiBL), compares biodynamic, organic, and conventional systems. DNA sequencing and microbial analysis have shown that the organic and biodynamic plots consistently feature higher microbial diversity and functionality. Within the first few years, these systems already showed greater resilience and microbial activity compared to conventional plots, highlighting the role of organic practices in fostering a healthy, living soil ecosystem.
Supporting Study: Mäder, P., Fließbach, A., Dubois, D., Gunst, L., Fried, P., & Niggli, U. (2002). Soil fertility and biodiversity in organic farming. Science, 296(5573), 1694-1697. doi:10.1126/science.1071148
FiBL – Research Institute of Organic Agriculture. DOK Trial: Long-Term Farming Systems Comparison in Switzerland. Retrieved from: https://www.fibl.org
5. Organic Almond and Grape Vineyards in California
In California, several almond and grape vineyards that transitioned to organic practices have used DNA analysis to monitor soil microbial changes. Within a few years, they reported a rise in beneficial mycorrhizal fungi and reduced pathogen levels, signaling a healthier, more resilient soil system. DNA sequencing tracked these positive shifts, confirming that organic management can replace harmful microbes with beneficial ones in soil over time.
Supporting Study: Steenwerth, K. L., & Belina, K. M. (2008). Cover crops enhance soil organic matter, carbon dynamics and microbiological function in a vineyard agroecosystem. Applied Soil Ecology, 40(2), 359-369. doi:10.1016/j.apsoil.2008.06.006
Hannula, S. E., & van Veen, J. A. (2016). The role of AM fungi in organic agriculture. Applied Soil Ecology, 96, 64-72. doi:10.1016/j.apsoil.2015.05.011
The Role of DNA Analysis in Understanding Soil Revival
DNA analysis has been a game-changer in soil science, allowing researchers to observe the specific microbial changes that occur when fields transition from conventional to organic management. By tracking shifts in microbial diversity and function, DNA testing provides clear, measurable evidence of how organic practices promote a healthy, balanced soil microbiome.
These studies illustrate that soil health restoration is achievable within a relatively short time under organic practices. While soils subjected to long-term conventional management may initially appear “dead” or lacking in microbial diversity, the examples above demonstrate that organic farming can foster microbial resilience and diversity, creating a foundation for sustainable, productive agriculture.
Organic farming practices have been shown to significantly improve soil health and microbial diversity compared to conventional farming methods. This article on recent DNA studies provides compelling evidence for the benefits of organic practices on soil ecosystems (eOrganic, 2023).
Increased Microbial Diversity and Abundance
Organic farming leads to greater microbial diversity and abundance in soils. Research in the Netherlands found that organically managed soils had higher numbers and more diverse populations of beneficial soil organisms compared to conventionally managed soils (Hartmann et al., 2015). Similar results were observed in banana plantation soils in Taiwan, with organic soils showing greater microbial diversity (Lehman et al., 2015). This increased microbial diversity is crucial for soil health, as it improves nutrient cycling, water retention, and disease suppression.
Enhanced Bacterial Communities
DNA studies reveal specific changes in soil bacterial communities under organic management. Organic systems show higher abundance of beneficial bacterial phyla like Acidobacteria, Firmicutes, Nitrospirae, and Rokubacteria (Hartmann et al., 2015). These bacterial groups correlate with improved soil biochemical properties and increased crop yields in organic systems (Lehman et al., 2015).
Improved Fungal Associations
Organic practices foster beneficial fungal relationships in the soil. Arbuscular mycorrhizal fungi (AMF) colonization is higher in organic soils (Hannula & van Veen, 2016). AMF extend plant root systems, improving water and nutrient uptake, especially in challenging conditions like drought or high soil salinity.
Soil Organic Matter and Carbon Sequestration
Organic farming significantly increases soil organic matter content. The National Soil Project found organic soils averaged 8.33% organic matter content versus 7.37% in conventional soils (National Soil Project). Organic soils showed higher levels of sequestered carbon (4.1% vs 2.85%) and a greater percentage of organic matter in stable forms (57.3% vs 45%). This increased organic matter improves soil structure, water retention, and carbon sequestration potential.
Nitrogen Fixation and Nutrient Cycling
Organic practices enhance natural nutrient cycling processes. Research suggests organic soybean plants may develop more extensive fine root systems and nitrogen-fixing nodules compared to conventional crops (Lehman et al., 2015). The diverse microbial communities in organic soils contribute to more efficient nutrient cycling and availability for plants (Hartmann et al., 2015).
Soil Enzyme Activity
Organic management boosts soil enzymatic activity. Higher levels of alkaline phosphatase and β-glucosidase activity are observed in organic systems (Bowles et al., 2014). These enzymes play crucial roles in organic matter decomposition and nutrient release.
In conclusion, DNA studies provide strong evidence that organic farming practices revitalize soil health by fostering diverse and abundant microbial communities, improving soil structure, enhancing nutrient cycling, and increasing carbon sequestration. These benefits create a more resilient and sustainable agricultural ecosystem.
Sources for Further Reading:
Hartmann, M., Frey, B., Mayer, J., Mäder, P., & Widmer, F. (2015). Distinct soil microbial diversity under long-term organic and conventional farming. The ISME Journal, 9(5), 1177-1194. doi:10.1038/ismej.2014.210
Lehman, R. M., Cambardella, C. A., Stott, D. E., Acosta-Martínez, V., Manter, D. K., Buyer, J. S., … & Halvorson, J. J. (2015). Understanding and enhancing soil biological health: The solution for reversing soil degradation. Sustainability, 7(1), 988-1027. doi:10.3390/su7010988
These resources provide additional insights into how soil biology supports agriculture and the role of organic practices in enhancing microbial diversity.
Dr. Tanumoy Bera is a Postdoctoral Research Associate at the Texas A&M AgriLife Research Center in Beaumont. In 2022 he was awarded a grant by Southern SARE with a project called, “Development of Sustainable Organic Rice Ratoon Production Systems in the Southern US,” and he has some excellent results so far with more to come. Here is a progress report from Dr. Bera and I think organic rice growers can benefit from his observations.
by Dr. Tanumoy Bera, Rice Researcher
While organic rice consumption in the U.S. has grown substantially in recent years, demand for domestically grown organic rice hasn’t kept pace. Instead, cheaper imports have dominated the market, creating challenges for U.S. producers trying to meet the increasing appetite for organic rice while maintaining profitability. To address these challenges, researchers at Texas A&M AgriLife in Beaumont are focusing on improving organic ratoon rice production—a method that allows rice to be harvested from the regrowth of previously harvested stubble. This technique is especially valuable because it enables a second harvest without the need to replant, which helps farmers reduce costs, increase productivity, and compete with lower-priced imports while still maintaining a viable net income per acre.
This ongoing study, initiated in 2022, aims to evaluate how rice cultivars, crop rotation practices, and nitrogen application rates affect the yield and quality of organic ratoon rice. The team tested two cultivars—Presidio and RiceTec XP753—alongside two management approaches: winter fallow and cover cropping. Their goal is to determine how these factors influence yield, milling quality, nitrogen content, and nitrogen removal in an organic ratoon system.
Early findings have been promising. The hybrid XP753 showed a remarkable performance, increasing the main crop yield by 75% and ratoon yield by 97% compared to Presidio. This is partly due to hybrid varieties like XP753 being bred to combine the best traits from parent plants, resulting in higher yields and greater resilience—key attributes for organic farming.
However, establishing cover crops in southeast Texas has been challenging, mainly due to wet winters and poor drainage in heavy clay soils. Despite these difficulties, cover crops, when successfully established, have provided significant benefits. To enhance nitrogen availability, the researchers utilized organic-approved inputs such as compost and cover crops, finding that an equivalent of 90 pounds of nitrogen per acre was optimal for achieving the greatest yields, with greater rates offering no additional advantage. This insight helps farmers optimize nitrogen inputs using sustainable sources, saving costs while promoting organic practices.
Looking ahead, the research will continue into the 2025 season, aiming to refine these findings and explore their long-term impacts. This work is crucial as demand for organic products continues to rise, providing farmers with improved productivity while supporting sustainable agricultural practices. With initiatives like this, Texas A&M AgriLife is helping pave the way for a more resilient and environmentally friendly future in agriculture.
When it comes to hay production, many farmers assume that bales harvested from the same field will contain similar nutrient levels. The differences across fields was evident in a recent article by Michael Reuter in Progressive Forage1. His article and data show us all, the significant differences even among bales from the same field. Understanding and managing these differences can make a big impact, especially for organic farmers who want to optimize livestock nutrition and maintain a consistent quality of forage.
Variability in Nutrient Composition: What the Data Tells Us
The following table from the article1 presents the nutrient composition and analysis of 20 individual bales randomly sampled from an 86-acre hay field, which was managed as a unit and harvested all at the same time:
The analysis of the 20 hay bales showed surprising variability in key nutrients such as Crude Protein (%CP), fiber content (measured as %ADF and %NDF), and essential minerals like Calcium (%CA) and Phosphorus (%P). Summary statistics of the nutrient composition are presented below:
Crude protein, for example, varied from 9.7% to 15.9%. This 6.2 percentage point difference could significantly influence the nutritional value of hay fed to livestock.
Fiber levels also differed substantially. The ranges in Acid Detergent Fiber (%ADF) and Neutral Detergent Fiber (%NDF) directly affect how digestible the hay is and how much livestock will eat. Calcium and phosphorus levels, which are critical for bone health and metabolic functions, also showed noteworthy differences between bales.
Why Does This Variability Happen?
Even in a well-managed hayfield, several factors can contribute to this nutrient variability:
Soil Fertility Differences: Organic amendments like compost or manure may not be evenly spread across the field. Variability in soil nutrients can cause different areas of the field to produce hay with varying nutrient levels.
Crop Rotation and Plant Diversity: Rotating different crops or allowing natural diversity in the field is beneficial for soil health, but it can also lead to differences in how well each crop absorbs nutrients.
Pest, Weed, and Microclimate Effects: Organic fields often have more variability in pest pressure, weed growth, and microclimates. These differences can lead to uneven growth, which in turn affects nutrient content.
Managing Nutrient Variability
To minimize these differences and provide more consistent forage quality, farmers can take several practical steps:
Soil Testing: Regularly test soil across different sections of the field. This helps identify nutrient deficiencies or hotspots, allowing targeted amendment application.
Even Amendment Application: When applying compost, manure, or other organic fertilizers, try to ensure even distribution across the field. Variability in amendment application is a key factor in nutrient inconsistency.
Use Cover Crops: Cover cropping can help improve soil structure and increase nutrient cycling, which leads to more uniform plant growth.
Monitor Harvest Stages: Harvesting at a consistent plant maturity stage across the field can help reduce variability. Plants harvested at different growth stages can differ significantly in nutrient content.
MatchingRegular Soil and Forage Testing: Applying soil nutrients based on soil tests and then testing multiple hay bales gives a clearer picture of the overall nutrient profile from start to finish. Testing hay allows adjustments in livestock feeding to meet nutritional needs effectively and maybe even save money!
Why Managing Nutrient Variability Matters
In organic systems, where synthetic supplements are not allowed, maximizing the natural nutrient content of forages is essential. Variable hay quality can significantly impact livestock health, as inconsistencies in nutrition may lead to reduced growth rates, lower milk production, or other health issues. Moreover, optimizing the quality of on-farm forage can reduce the need for expensive purchased supplements and any organic supplements are not cheap.
Maintaining consistent forage quality also supports animal welfare, which is a core value of organic and sustainable farming. Healthy, well-fed animals are more resistant to disease, aligning with the organic principle of promoting natural immunity and reducing intervention.
Conclusion
Variability is a natural part of farming, but with informed management, we can turn that variability into an opportunity for learning and improvement—ultimately providing better feed for our livestock and keeping our farms resilient.
1.Data Source: October 1, 2024 issue of Progressive Forage written by Michael Reuter, Analytical Services Technical Manager at Dairy One Cooperative Inc. and Equi-Analytical Labs.
In case you didn’t know: Texas has impressive diversity in its organic agricultural production. The organic crops grown in Texas encompass staple commodities such as peanuts, cotton, corn, wheat, sorghum, alfalfa, rice, hay, grass, and soybeans. Beyond these staples, Texas farmers cultivate a wide array of vegetables, including lettuce, spinach, onions, tomatoes, peppers, kale, radishes, garlic, and microgreens. The state’s organic fruit production features watermelons, strawberries, blueberries, and various citrus fruits like grapefruits and oranges. Additionally, a variety of herbs such as basil, cilantro, dill, parsley, and other spices are grown organically. Texas also supports the cultivation of flowers, transplants, and specialty crops like mushrooms, aloe vera, and cacti.
Complementing its crop production, Texas’s organic agriculture sector includes a growing livestock industry. Organic farmers in the state produce milk and from milk lots of other dairy products like butter and cheese. There is a growing demand for dairy products nationwide and Texas leads in organic dairy.
Texans also raise organic chickens, turkeys, and cattle, supplying organic beef, poultry, and eggs to consumers. Moreover, Texas organic producers’ market organic beef and dairy replacement livestock, which are sold to organic operations both within the state and across the country. This extensive range of organic crops and livestock products demonstrates Texas’s rich and diverse organic agriculture sector, solidifying its position as a leader in organic farming.
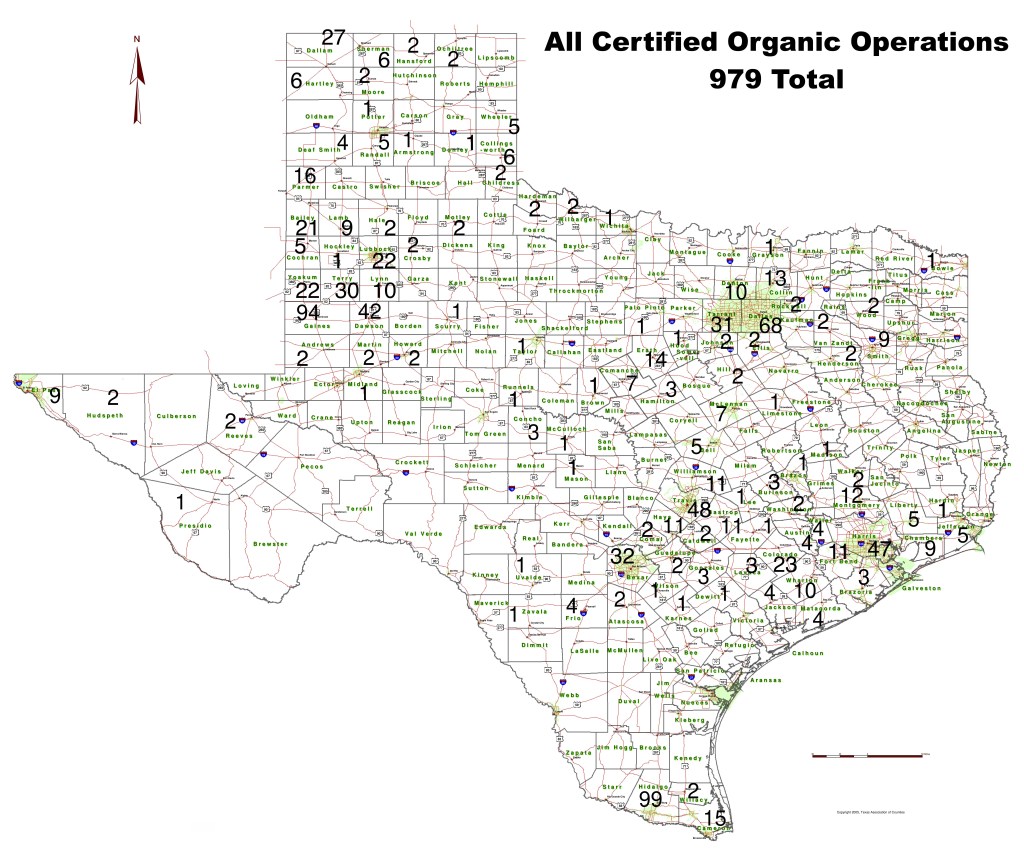
So, what does a typical organic producer in Texas look like? Well this producer is probably located in one of 5 organic “hot spots” in Texas – the High Plains from Amarillo north and doing dairy, grain or silage crops; or maybe the South Plains from Lubbock south to Andrews growing peanuts, cotton or wheat; or possibly in the Central Texas area bounded by Comanche and Waco south to Austin, and growing forage crops for more dairy producers or small acreage vegetables; or maybe in the Gulf Coast area from Beaumont to El Campo growing organic rice; or this organic producer is possibly in the Rio Grande Valley right up against the Mexico border growing citrus and vegetables. With over 576,000 acres certified organic they are scattered across a big state. And they aren’t small either with the average sized organic farm being 1,249 acres. Even the median (right in the middle of the list) acreage at 370 acres is considered large for most states’ organic programs – everything is bigger in Texas!