The organic label is more than just a marketing term; it is a rigorous standard of quality that reflects sustainable and environmentally friendly practices across the agricultural sector. The USDA’s National Organic Program (NOP) is at the heart of this movement, ensuring that products labeled as organic meet stringent, federally regulated guidelines. This unified regulatory framework is crucial not just for maintaining the integrity of the organic label but also for investing in and supporting a diverse array of stakeholders involved in the organic supply chain—from farmers and researchers to retailers and consumers. Tools such as the USDA Organic Consumer Outreach Toolkit play a vital role in promoting these standards, ensuring that the value of organic products is clearly communicated and understood by the consumer but also by those outside looking in and examining the organic program family!
The Unified Regulatory Framework of Organic Agriculture
Organic agriculture operates under a comprehensive framework established by the NOP, which enforces consistency across the entire supply chain. This uniformity ensures that whether one is dealing with an organic dairy farm in Texas or a producer of organic vegetables in California, or a feed manufacturer in Illinois, all parties are held to the same high standards. This regulation not only supports the integrity of organic products but also helps streamline processes for stakeholders at all levels, including brokers, wholesalers, manufacturers, and retailers. The ability to trust in the label “organic” comes from this rigorous oversight and the commitment to upholding these standards universally.
Collaborative Efforts Across Stakeholders
One of the most remarkable aspects of the NOP’s structure is its collaborative nature, which fosters engagement across a broad spectrum of stakeholders. This collaboration includes:
Educational institutions and specialists: As an organic specialist with a land grant university, my role involves educating and guiding future and current farmers on best organic practices. Even specialists without organic in their title like agronomists, entomologists or plant pathologists contribute to organic knowledge and expertise. More and more these folks are finding ways to work with our natural plant and animal systems advancing organic agriculture.
University researchers are doing tremendous work and through their efforts organic ag is advancing faster and faster. I know, because of the many current organic grant projects just in Texas. Other research bodies, both public and private research, also are a part of this huge collaboration to advance organic agriculture from the farm all the way to the table.
Organizations and associations like the Organic Trade Association (OTA), The Organic Center (TOC), Organic Farm Research Foundation (OFRF) and many other non-profits work tirelessly to promote organic production practices and products, help foster collaborations, and advocate within the halls of government.
Certification entities and even certification inspectors all work together with growers and handlers to ensure that the system is protected from simple mistakes to outright fraud protecting a consumer based and backed program. They are not doing this just for themselves but for the grower and handler who needs the consumer to buy their products because they are certified organic.
Education and Outreach: Tools for Sustaining Organic Integrity
The USDA Organic Consumer Outreach Toolkit exemplifies the educational tools that are crucial for sustaining the integrity of the organic label. This toolkit is designed to educate stakeholders along the supply chain and inform consumers about what the organic label represents. Clear, consistent messaging helps to ensure that the organic label retains its value and significance in the marketplace. For instance, retail employees can use the toolkit to better explain the benefits of organic products to customers, reinforcing trust and understanding.
I will admit this is a tough one! We do not have the support systems and advisory services we need within the organic community. Extension organic specialists and county extension agents and even private advisors and consultants to provide ongoing support and guidance, have been in short supply – but it is improving. This continual knowledge exchange is vital for keeping up with the fast-changing organic systems research, the new and innovative products for organic production, the regulatory environment we work within and of course, any and all emerging trends in organic agriculture.
Traceability and Transparency: Building Consumer Trust
A cornerstone of the NOP’s approach is the emphasis on traceability and transparency. From farm to retail store, every step of the organic product’s journey is documented (and includes a certified entity), ensuring that the products consumers buy are genuinely organic. This traceability not only helps in enforcing compliance with organic standards but also builds consumer confidence in the organic label. According to a recent consumer survey conducted by the Organic Trade Association 88% of all consumers know about the organic label and are willing to pay more because of their trust in the label.
Conclusion
The USDA National Organic Program’s structured approach to regulating and promoting organic agriculture underpins the integrity and trust in the organic label. By fostering a unified and collaborative framework, the NOP ensures that organic standards are not just ideals but practical realities that benefit the environment, producers, and consumers alike. As we look to the future, your continued support and participation in this program will be crucial for advancing sustainable agricultural practices and increasing organic farming, manufacturing, retailing and consumption. How? By realizing you are part of an “organic family” that promotes you and your business along with every other part of the value chain (traceability means you get promoted) all the way to the consumer who picks up your product and knows you are part of that product.
I know that all these rules and regulations and the piles of paperwork get overwhelming but know that this helps the consumer to feel a part of your production and ultimately your farm. Here are a few examples or Case Studies of what things may look like in the future as we try to invite the consumer to be part of this value chain known as Organic Farming.
Some real-world examples of building consumer trust
Case Study 1: Carrefour and Blockchain
Overview: Carrefour, (big in Europe and the Middle East) a global retail giant, launched a blockchain-based traceability system for several products, including organic fruits and vegetables. The system allows consumers to scan a QR code on the product packaging to access detailed information about the production process.
Key Features:
Farm to Fork Information: Consumers can see details about where and how the organic produce was grown, including the farm’s location, the farming practices used, and the harvest date.
Transparency and Trust: By providing a clear view of the supply chain, Carrefour enhances consumer trust in their organic label.
Case Study 2: IBM Food Trust and Walmart
Overview: Walmart joined the IBM Food Trust, a blockchain-based system, to improve the traceability of its food products. The initiative initially focused on conventional products but has extended to organic products to ensure their integrity.
Key Features:
Enhanced Traceability: The system tracks every transaction from the supplier to the store, ensuring that organic standards are maintained at every step.
Rapid Response to Issues: If an issue arises, such as a contamination risk, Walmart can quickly trace the product back to its source and manage the situation effectively.
Case Study 3: Ripe.io and Tomato Traceability
Overview: Ripe.io uses blockchain technology to provide transparency in the tomato supply chain. Although not exclusively organic, the principles applied can directly benefit organic markets by detailing each step of a tomato’s journey from seed to supermarket.
Key Features:
Detailed Product Insights: Information on when and how tomatoes were planted, cared for, harvested, and transported are all recorded.
Consumer Feedback Integration: Consumers can provide feedback on the quality of the product, which can be used to improve farming practices.
The global wine industry is witnessing a pivotal shift towards organic practices, a trend strongly reflected in the Lone Star State. Although Texas’s organic grape production is currently led by only 3 farmers cultivating over 200 acres, this growing segment is set to change the Texas wine landscape. This rise in organic viticulture, coupled with an increasing consumer interest in organic wines over the last decade, sets the stage for a deeper exploration of innovative solutions like Fungus Resistant Grape (FRG) varieties.
Why Organic? The Texas Perspective
In Texas, where the climate varies from the arid conditions of the High Plains to the humid Gulf Coast, viticulturists face a unique set of challenges. Disease pressure, particularly from fungal pathogens, is a significant concern that can compromise grape quality and yield. Herein lies the importance of FRG varieties, which offer hope for organic viticulture in Texas and similar environments. The adoption of these disease-resistant varieties can not only enhance the sustainability of vineyards but also align with the growing consumer demand for wines produced “environmentally friendly.” There is a tremendous amount of evidence that the organic label has a huge and growing recognition with consumers, and they are buying organic at an ever-increasing rate.
The Organic Wine Boom
Nationally and globally, the last decade has seen a marked increase in interest and sales of organic wines. Consumers are increasingly drawn to organic labels, not just for the perceived health benefits but also for their environmental impact. This shifting preference underscores the need for viticulture practices that prioritize ecological balance and sustainability. In Texas, where the wine industry is as dynamic as it is diverse, the integration of FRG varieties into organic viticulture holds the promise of meeting this demand while addressing the agronomic challenges of organic grape production.
Disease Resistance: A Game-Changer for Organic Viticulture
In past research FRG varieties such as Regent and many others have demonstrated remarkable resilience against fungal diseases that commonly afflict vineyards, reducing the reliance on fungicides and thus supporting organic farming principles (Pedneault and Provost, 2016). The most common Fungus-Resistant Grape (FRG) varieties grown and sold today include:
Regent
Regent: Developed in Germany, Regent is popular in cooler wine regions due to its resistance to both downy and powdery mildew. It produces red wines with deep color and robust flavors.
Marechal Foch: An early-ripening variety known for its resistance to several grape diseases, including downy mildew. It is used to make a range of wines from light reds to rich, full-bodied wines with dark fruit flavors.
Seyval Blanc: This variety is resistant to powdery mildew and is versatile in winemaking, used for producing everything from sparkling wines to well-balanced still whites.
Solaris: Bred in Sweden, Solaris is resistant to most fungal diseases and is suitable for organic viticulture. It produces aromatic white wines with high acidity and tropical fruit flavors.
Marquette: A cold-hardy variety developed by the University of Minnesota, Marquette is resistant to downy and powdery mildew and produces medium-bodied red wines with notes of cherry, blackberry, and spices.
Camminare Noir: developed by the University of California, Davis, as part of their breeding program for disease-resistant grapes, is a hybrid cross between a Vitis vinifera wine grape variety (94%) and American species known for their disease resistance. It is highly resistant to Pierces disease (PD), powdery mildew and downy mildew, making it particularly well-suited for regions where these fungal diseases are significant challenges.
Crimson Cabernet: developed by David and Ann Munson in Missouri, USA, is a hybrid of Norton (Vitis aestivalis, native to North America) and Cabernet Sauvignon. Bred specifically for cold climates, it offers excellent resistance to PD and to fungal diseases, including black rot and mildews. Norton contributes exceptional disease resistance and cold hardiness, while Cabernet Sauvignon imparts high wine quality and a recognizable flavor profile.
Paseante Noir: Produces wines similar to Pinot Noir, offering a light to medium body with delicate fruit flavors and good structure. It is resistant to Pierce’s Disease and moderately resistant to fungal diseases like powdery mildew. This variety is ideal for warmer regions with high PD pressure but performs well in less disease-prone areas too.
Errante Noir: Produces full-bodied red wines reminiscent of Syrah, with rich fruit flavors, good tannin structure, and aging potential. It combines strong resistance to Pierce’s Disease with moderate fungal resistance, making it an excellent option for growers in hot climates with heavy PD pressure.
Ambulo Blanc: White variety that resembles Sauvignon Blanc in its crisp acidity, citrus notes, and fresh aromatics. It offers high resistance to Pierce’s Disease and moderate fungal resistance, making it suitable for humid, warm regions where white grape production is challenging.
Caminante Blanc: Produces wines akin to Chardonnay, with balanced acidity and flavors of apple, pear, and subtle oak when barrel aged. It is highly resistant to Pierce’s Disease and moderately resistant to fungal pathogens, thriving in regions with significant PD pressure while supporting premium white wine production.
Regarding the use of FRG varieties in Texas, these varieties could translate to lower production costs, reduced environmental impact, and the potential for higher yields—key factors in the sustainability equation of organic viticulture. However, Texas’s diverse climate and the presence of various grape diseases make the state a potential area for adopting FRG varieties. The interest in sustainable and organic viticulture in Texas, along with the challenges posed by fungal diseases, suggest that FRG varieties could offer valuable solutions for Texan vineyards looking to reduce chemical inputs and manage disease more effectively.
Taste the Difference: The “Organoleptic” Advantage
Beyond the agronomic benefits, the organoleptic qualities (fancy word for a food or wine that stimulates our sense of taste or smell) of wines produced from FRG varieties offer a great argument for their adoption. Initial tastings and analyses reveal that these wines can compete with, if not exceed, the sensory profiles of wines made from traditional grape varieties (ones demanded now because they are considered superior). The promise of rich, complex flavors, coupled with the environmental benefits of organic viticulture, presents a compelling value proposition to consumers and wine “connoisseurs” alike. FRG varieties can change the industry for the better if allowed to by the very industry keeping them out!
Looking Ahead: Organic Viticulture in Texas
The growth of organic grape production in Texas, though in its early stages, is indicative of a broader trend towards sustainable viticulture practices. As the interest in organic wines continues to surge, the role of FRG varieties in enabling eco-friendly and economically viable grape production becomes increasingly significant. For Texas, a state known for its agricultural innovation and resilience, the adoption of FRG varieties and increase in organic viticulture could mean a significant change for the Texas wine industry—one that is sustainable, flavorful, and aligned with the increasing global shift towards organic production.
The trends surrounding Fungus-Resistant Grape (FRG) varieties reflect an intersection of sustainability, consumer preferences, and technological advancements. These trends are shaping the future of viticulture and winemaking, positioning FRG varieties as a pivotal innovation in the industry. Here are some key trends:
1. Increased Adoption in Organic Viticulture
FRG varieties are gaining traction among organic vineyards due to their inherent resistance to common fungal diseases, which reduces the need for synthetic chemical treatments.
2. Consumer Awareness and Acceptance
There’s a growing awareness among consumers about the environmental and health impacts of pesticide use in agriculture. As a result, wines produced from FRG varieties are increasingly seen as a healthier and more sustainable option. However, consumer acceptance varies, with a large segment of the market very cautious about genetically modified organisms (GMOs). FRG varieties are mostly being developed through traditional breeding methods rather than genetic engineering making them attractive to organic growers and consumers.
3. Technological Advancements in Breeding
Advances in breeding technologies, including genetic mapping and marker-assisted selection (these are approved organic practices), have significantly improved the quality and disease resistance of FRG varieties. These technological advancements enable the development of new varieties that retain the desired sensory qualities of traditional Vitis vinifera grapes while incorporating disease resistance from other grape species.
4. Regulatory and Policy Shifts
Changes in regulations and policies are influencing the adoption of FRG varieties. Some European regions are recognizing the benefits of these grapes in reducing chemical inputs and are adjusting regulations to support their use. Additionally, there’s a push for clearer labeling practices to inform consumers about the sustainable attributes of wines made from FRG varieties, especially organically produced FRG varieties!
5. Economic and Environmental Sustainability
The economic benefits of adopting FRG varieties are becoming more apparent to growers, including reduced costs associated with disease management and potential for higher yields due to decreased disease pressure.
6. Focus on Quality and Sensory Profiles
Initially, concerns existed about the sensory qualities of wines made from FRG varieties. However, ongoing research and development efforts focus on breeding FRG varieties that produce high-quality wines, comparable to those made from traditional grape varieties. This includes optimizing viticultural practices and winemaking techniques to enhance the sensory profiles of FRG wines.
7. Collaborative Research and Development
There’s a trend towards collaborative efforts among research institutions, breeders, and the wine industry to develop and promote FRG varieties. These collaborations aim to pool resources and knowledge to address the challenges of climate change, disease pressure, and sustainability in viticulture.
In summary, the trends for FRG varieties are driven by a confluence of sustainability concerns, technological innovations, and evolving consumer preferences. These trends highlight the growing importance of FRG varieties in the future of sustainable winemaking and organic viticulture.
As we witness the expansion of organic viticulture in Texas, the future of wine production appears promising. With each vineyard turning to Fungus Resistant Grape varieties, we edge closer to a wine industry that is not only kinder to the planet but also offers wines of exceptional quality and taste. The path forward for Texas and the wine world at large is clear: embracing organic practices and the innovative potential of FRG varieties is not just a trend, but the future of sustainable viticulture.
Source: Pedneault, K., & Provost, C. (2016). Fungus Resistant Grape Varieties as a Suitable Alternative for Organic Wine Production: Benefits, Limits, and Challenges. Scientia Horticulturae, 208, 57-77.
Here is an article from Florida by way of resistant grape varieties from UC-Davis. It follows along the lines of my blog here.
Can water be one of the best weed management tools in organic rice? Explore how water-seeding, flooding, and drainage suppress weeds, with lessons from Texas rice fields and Lundberg Family Farms.
Originally published March 26, 2024. Updated November 2026 with additional information on water management and organic weed control from Lundberg Family Farms.
Dr. Ronnie Levy, Retired Extension Rice Specialist at LSU wrote this article for the April 2022 issue of Rice Farming Magazine. I clipped it out and thought, “this will come in handy someday!”1 I am putting this out there again because our organic rice producers are facing some real problems with weeds in rice including weedy rice, hemp sesbania, jointvetch and certainly weedy grasses.
In 2023, I was at Joe Broussard’s farm near Nome, looking at a rice field that was headed out and looking great. On the other side of the levy was a field choked with weeds – what was the difference? One was water-seeded rice, and the other was not. Joe had used water seeding and his flood to control weeds “the old-fashioned way!” So, read this article by Dr. Levy and think about it……
“Most rice is drill-seeded in Louisiana — about 80% — but there is a renewed interest in water-seeding rice for weedy rice suppression (or many other weeds in organic systems).”Rice Farming, April 2022. Dr. Ron Levy.
The most common water-seeding method in Louisiana is the pinpoint flood system. After seeding, the field is drained briefly. The initial drain period is only long enough to allow the radicle to penetrate the soil (peg down) and anchor the seedling. A three- to five-day drain period is sufficient under normal conditions.
The field then is permanently flooded until rice nears maturity (an exception is midseason drainage to alleviate straighthead (physiological problem of rice) under certain conditions).
In this system, rice seedlings emerge through the floodwater. Seedlings must be above the water surface by at least the 3 to 4-leaf rice stage. Before this stage, seedlings normally have sufficient stored food and available oxygen to survive. Atmospheric oxygen and other gases are then necessary for the plant to grow and develop.
The pinpoint flood system is an excellent means of suppressing weedy rice emerging from seeds in the soil because oxygen necessary for weedy rice germination is not available as long as the field is maintained in a flooded (or saturated) condition. A continuous flood system, another water-seed system, is limited in Louisiana. Although similar to the pinpoint flood system, the field is never drained after seeding.
Regarding the water-seeded systems, a continuous flood system is normally best for red rice suppression, but rice stand establishment is most difficult. Even the most vigorous variety may have problems becoming established under this system. Inadequate stand establishment is a common problem in both systems.
Fertilization timing is the same for both the pinpoint and continuous flood systems. Phosphorus (P), potassium (K), sulfur (S) and zinc (Zn) fertilizers are applied preplant incorporated as in the dry-seeded system. Once the field is flooded, the soil should not be allowed to dry.
If the nitrogen requirement of a particular field is known, all nitrogen fertilizer can be incorporated prior to flooding and seeding or applied during the brief drain period in a pinpoint flood system. Additional N fertilizer can be applied at the beginning of reproductive growth between panicle initiation and panicle differentiation (2-millimeter panicle).
Water-seeding has been used in the past for weed control. Will water-seeding make a comeback to help with weedy rice suppression (or possibly for organic rice producers)?”
Dr. Levy’s discussion describes how water-seeding can help suppress weedy rice while presenting challenges for stand establishment. Another approach, developed through decades of organic rice production in California, demonstrates how carefully timed flooding and drainage can help manage different weed populations.
Learning from Lundberg Family Farms: Using Water to Control Weeds in Organic Rice
One of the most interesting examples of water management for organic rice production comes from Lundberg Family Farms in Richvale, California. In a recent article published by Rice Farming2, the Lundberg family’s approach to using flooding and drainage for organic weed management was described in detail. The Lundberg family began growing organic rice in 1969 and has spent decades developing production practices that rely on water management rather than conventional herbicides for weed control.
Their experience provides some useful lessons for our Texas organic rice producers.
The Lundbergs have learned that water depth and timing can make an enormous difference in controlling weeds. By maintaining relatively deep floodwater during early rice development, they can suppress certain grass weeds while allowing the rice crop to continue growing. Once those weeds have been suppressed, they drain their fields to create conditions unfavorable for aquatic weeds that thrive in standing water.
Flooding suppresses some weeds, while draining can suppress others. The challenge is knowing when to change water levels without injuring the rice.
Aerial view of rice fields in California’s Sacramento Valley. Photo credit: Lundberg Family Farms.3
Making this system work requires precisely leveled fields, reliable irrigation and drainage systems, vigorous rice seedlings, and careful observation of weed and crop development. It also requires an understanding of the weeds present because not all weeds respond to flooding in the same way.
What Does This Mean for Texas Organic Rice?
Our organic rice growers face some serious weed challenges, particularly weedy rice, grasses, hemp sesbania, and jointvetch. Water-seeding and flood management offer opportunities to suppress some of these weeds, but no single water management practice will control all of them.
I believe the most important lesson from Lundberg Family Farms is that we should consider water management as part of a complete organic weed control program rather than simply as irrigation. Variety selection, seedling vigor, field preparation, leveling, fertility, and water management all work together.
I also believe there are opportunities for additional research in Texas to evaluate water-seeding methods, rice varieties, and flood management strategies under our growing conditions.
The experience I had visiting Joe Broussard’s farm near Nome several years ago demonstrated that water-seeding can make a tremendous difference in weed management. The Lundberg family’s experience reinforces what I saw in that field.
Although water-seeding offers important opportunities for weed suppression, it also creates conditions favorable for certain aquatic insects. Rice seed midges are one example, particularly during the vulnerable period between germination and early seedling establishment.
Rice Seed Midges – The larvae of these insects (Order Diptera, Family Chironomidae, Genera Tanytarsus and Chironomus) are aquatic and can be very abundant in rice fields. The adults are small, gnat-like flies that typically form inverted pyramidal mating swarms in the spring over stagnant or slow-moving water. Female flies lay eggs in ribbons on the water surface. The larvae hatch and move downward to the flooded substrate where they build protective “tubes” of silk, detritus, and mud. These brown; wavy “tubes” are easily observed on the mud surface of rice paddies. Occasionally, the larvae will exit the tubes and swim to the surface in a whiplike fashion, similar to that of mosquito larvae. Midge larvae can damage water-seeded (pinpoint or continuous flood) rice by feeding on the sprouts of submerged germinating rice seeds. Damage can retard seedling growth or kill seedlings; however, the window of vulnerability to midge attack is rather narrow (from seeding to when seedlings are about 3 inches long).
Control rice seed midge problems by dry seeding, then employing a delayed flood, or by draining water-seeded paddies soon after planting. Thus, a pinpoint flood should reduce the potential for rice seed midge damage relative to a continuous flood. For water-seeded rice, reduce rice seed midge problems by increasing the seeding rate and planting sprouted seed immediately after flooding.
The following California research article evaluates several treatments for rice seed midge management. Organic rice producers should verify the current registration and organic production status of any material before considering its use.
Last year USDA put out the call for grant applications for the Organic Market Development Grant program. This was a chance to apply for up to $3 Million in grant funds with a match or up to $100,000 for equipment with no match. The Organic Market Development Grant (OMDG) program supports the development of new and expanded organic markets to help increase the consumption of domestic organic agricultural commodities. The program focuses on building and expanding capacity for certified organic production, aggregation, processing, manufacturing, storing, transporting, wholesaling, distribution, and development of consumer markets. OMDG aims to increase the availability and demand for domestically produced organic agricultural products and address the critical need for additional market paths.
Texas organic producers have excelled in their efforts, submitting a multitude of grant applications, and the results are now in. Below, discover the exceptional organic projects that have been chosen to enhance organic agriculture in Texas for the foreseeable future.
Promotion of Organic Yaupon Tea as a Domestic Alternative to Imported Tea Distributed to The Foodservice Industry
Recipient: Yaupon Holly Tea, LLC, Cat Spring, TX
This project aims to increase the American consumer awareness of organic yaupon tea as a replacement for imported tea via the food service sector. An Organic Yaupon Marketing Plan will increase opportunities for consumer exposure to organic yaupon tea while also allowing for additional customers, buyers, and parties to participate in the domestic organic yaupon tea industry. Yaupon is a caffeinated plant native to North America and rich in polyphenols and antioxidants like imported tea. By using a hybrid of traditional tea preparation methods, organic yaupon tea has an almost indistinguishable flavor profile from imported green and black tea served in both hot and iced tea. Cat Spring Yaupon has created a cohesive marketing and outreach plan to increase the amount of organic yaupon tea served in restaurants, cafes, hotels, and spas. This plan incorporates the opportunity to promote and support additional organic yaupon producers through the American Yaupon Association while also supplying to tea companies who would otherwise be selling imported tea to their food service customers. This will also allow restaurants to substitute imported tea on their menus with organic yaupon tea thus giving their customers and guests an opportunity to sample and fall in love with the incredible domestic organic yaupon tea.
Diversifying Organic Supply Chains for Small Producers in the Rio Grande Valley
Recipient: Triple J Organics, LLC, Mission, TX
Triple J Organics is a minority-owned certified organic citrus orchard in Mission, Texas established in 1995. Triple J manages 25 acres of certified organic citrus groves, primarily of Ruby Red grapefruit and early season oranges, as well as Navel Oranges, Meyer Lemons, Tangerines, and Tangelos in smaller quantities. This project will increase consumption of locally produced organic orange juice in the Rio Grande Valley and increase the profitability and long-term viability of Triple J Organics through special purpose equipment purchases that allow Triple J to process 32,000 lbs. of “waste”, or seconds, oranges into fresh juice and deliver it safely to customers in the Valley. The project will target school districts as potential customers, as well as supermarkets, restaurants, health food stores, daycare facilities, and eldercare facilities as needed. Beneficiaries include Triple J Organics, local schools and businesses who purchase the new product, as well as other organic citrus growers in the Valley who may be able to cooperate and aggregate to produce a higher margin value-added product.
Steelbow Farm: Expanding Access to Local, Organic Produce in Central Texas
Recipient: Steelbow Farm LLC, Austin, TX
Steelbow Farm is seeking to broaden its delivery range and increase local food access and supply chain resilience by procuring a delivery vehicle. The overarching purpose of the proposed project is to expand access to local, organic produce by eliminating the current constraint of distance and delivery radius, while simultaneously addressing the growing demand for product in the current marketplace. Currently, Steelbow Farm has demand for their product that exceeds their capacity because they do not have a vehicle and therefore have a limited delivery range. This bottleneck is hampering Steelbow Farm’s ability to rise to the organic market demands. They believe access to this equipment would drastically improve access to organic produce, as they could radically increase their customer base and range. For context, currently, within Travis County, only .06% of food is produced locally. The Austin and Travis County areas are seeing a decline in the amount of vegetable farms and farmland, which are disappearing at an alarming 16.8 acres a day. Amidst these startling statistics, this business is thriving and demand for their produce is extremely high. Steelbow Farm wants to be able to meet the market demand and fill the gap within the local food system. As organic vegetable producers, they are striving to increase the percentage of local food consumed within their community.
Enhancing Organic Dairy Production and Market Access in Texas
Recipient: Armagh Fine Foods LLC dba Armagh Creamery, Dublin TX
The primary goal of this project is to enhance and expand the production capabilities of the Armagh Creamery organic farming and dairy operations. By acquiring essential equipment, the project aims to achieve increased efficiency, product diversification, and expanded distribution. This equipment will enable us to venture into new product lines, including heavy cream and butter, expand production of existing products, and streamline the production process, reducing the workload on current employees and enhancing overall efficiency for creating new butter product lines. The acquisition of a delivery vehicle will significantly improve distribution capabilities, allowing us to reach local retailers and drop locations in Central, North, and West Texas. This expansion will promote the availability of organic dairy products to a wider consumer base. The specific objectives of this project are two-fold: 1) to scale yogurt production to the full daily capacity of 10,000 units per day, two days a week. This increase will enable us to supply more retailers throughout Texas and cater to the growing demand in the direct-to-consumer market and 2) to expand raw milk and cream production to 600 gallons a day for 3-4 days a week, resulting in a weekly output of 1800 to 2400 gallons. This expansion will further support the direct-to-consumer market and provide ample resources for the planned heavy cream and butter product lines.
Expanding Capacity and Improved Quality of Organic Cotton
RKH Gin LLC, dba Woolam Gin is a primarily woman owned ginning facility that has processed organic cotton for 33 years, being the first United States to do so. It is located in a high poverty area in Lynn County, Texas and serves other high poverty areas including Dawson and Terry Counties. Woolam Gin is seeking a grant award to purchase and install equipment to expand the services and improve processing to increase production of organic cotton for farmers which will improve overall market production of the beneficial product. The overarching project purpose is to improve efficiency, therefore improving outcomes for farmers and the organic market. The equipment will increase production from 25 bales an hour to up to 40 bales an hour. The increase in processing will improve the housing time of cotton in the warehouse which will improve the grades and facilitate earlier entry into the marketplace, benefiting farm producers, processors, and consumers. Faster processing will improve turnaround for the farmer and further increase production possibilities. The primary partners and collaborators of the project will include participating organic farmers, the project manager, project supervisor, gin manager and other supporting human resources workers. This grant award will create improved markets and expand processing capacity which in turn will enrich market availability and further development of production resources and production.
Texas Organic Market Development & Promotion
Recipient: Texas Department of Agriculture, Austin, TX
The Texas Department of Agriculture (TDA) will use a multi-faceted approach to promote local organic producers in the produce, grains, dairy, and fiber markets. Though these industries are each unique in their production, the issues they experience are similar. These challenges include, but are not limited to, lack of knowledge among consumers of each industry’s availability/benefits, existing gaps between producers and buyers that result in barriers for growth, and an absence of public resources that assist organic farmers from promoting themselves more efficiently. Through this project, TDA will increase local consumer knowledge, support activities to develop new markets, increase demand for domestically produced organic agricultural products, and provide additional market paths for organic farmers in Texas. Goals of this project include: 1) increase public knowledge of Texas organic agriculture industry, 2) provide opportunities to improve market share and sales of local organic producers, and 3) build new connections between Texas producers and potential buyers to accomplish these goals. TDA Marketing will produce new marketing materials targeted for the organic industry, assist organic producers with attending trade shows relevant to their respective industries, facilitate business to business interactions, and run a social media campaign that highlights each industry. These activities will strengthen the relationships between Texas organic crop/product producers and buyers, as well as better inform the public on the availability and benefits of Texas organic products. These relationships would aid in ongoing efforts to strengthen the supply chain issues, build on current opportunities with Texas agriculture associations, assist historically underserved communities, and increase demand for locally produced organic products. To further assist the organic industries of Texas, TDA will assist in the production of the Field View Organics program. This program aims to identify organic operations across the state and mark them for aerial spraying companies to help prevent potential chemical drift or contamination of organic crops. By supporting this initiative, TDA will protect the current organic producers across the state and alleviate potential concerns for new members wanting to enter the industry.
Here is the entire list of projects funded by USDA for the entire country. This list should give you some ideas for submitting an application for the next grant program that come along! Organic Grant Winners
(This article first appeared in “Texas Dairy Matters” and has since been published in Texas Ag and Dairy Review. I have had an opportunity to work with some of these technologies and these researchers on an organic dairy investigating the potential to improve both mastitis control and long-term animal health. Bob Whitney)
Non-Antibiotic Management of Mastitis in Dairy Cattle
1 Graduate Research Assistant 2 Assistant Professor. Department of Animal Sciences, Texas A&M AgriLife Extension Service, The Texas A&M University System
Mastitis is a common and costly disease affecting dairy cattle worldwide. It is characterized by inflammation of the mammary gland, typically caused by bacterial infection. Mastitis is typically managed on dairy herds with intramammary antibiotics. However, not all mastitis events respond to treatment with antibiotics, depending on the pathogen associated with the disease event and cow level factors. In addition, prudent and appropriate use of antibiotics is an essential step in achieving antimicrobial stewardship in dairy farms. In some management systems such as organic systems, the use of antibiotics is restricted (USDA, 2017). This presents the need to explore options to manage mastitis without the use of antibiotics.
In this article, we discuss. some strategies currently being evaluated by our group to manage mastitis events.
A) Acoustic pulse technology:
Acoustic pulse technology, APT, has emerged as a promising non-antibiotic therapy for managing mastitis in dairy cattle. Specifically adapted for treating mastitis, APT uses repeated projectile collisions with an anvil connected to the treatment head. These collisions generate low-incidence shockwaves or acoustic pulses that are transferred non-invasively to the affected mammary gland tissues. Similarly to ultrasound therapy, ATP uses sound waves to deliver energy. However, APT delivers lower-frequency sound waves that can penetrate deeper into tissues compared to ultrasound therapy. The therapeutic effects of APT include promoting recovery, reducing inflammation, and potentially improving blood flow and immune responses (Leitner et al., 2021). Recent studies have shown positive outcomes, such as increased recovery rates, reduced culling and additional milk yield in APT-treated cows compared to controls (Blum et al., 2023). This innovative approach offers an alternative to antibiotics, contributing to udder health and overall dairy cow welfare.
B) Cold laser therapy:
Cold laser therapy, also known as low-level laser therapy, has been explored as a potential non-antibiotic treatment for mastitis in dairy cattle. Cold laser therapy is currently used by many veterinarians as an alternative therapy approach to manage inflammation in small and large animals, including horses. This technology works on the principle of “photobiomodulation,” which refers to a therapeutic technique that uses light energy to stimulate cellular processes. In the context of dairy cattle, photobiomodulation has gained attention for its potential benefits in various aspects of herd health and productivity. There are reports of this technology used to promote wound healing and tissue repair. Photobiomodulation can accelerate wound healing and tissue repair by promoting cellular metabolism and enhancing blood flow. The technology can also help with pain management as the anti-inflammatory effects of photobiomodulation can help alleviate pain and discomfort. It has particularly been useful for managing conditions like lameness or joint inflammation (Gard et al., 2017).
Photobiomodulation has been explored as an adjunctive therapy for mastitis treatment. By reducing inflammation and promoting immune responses, it may aid in faster recovery. Light-emitting diodes, LEDs, or lasers are used to deliver specific wavelengths of light to targeted areas for a specific duration. Treatment protocols vary, but sessions are typically short and non-invasive. Although research is ongoing by our group, the results have indicated potential benefits. In à separate study, the laser irradiation resulted in a 16.6% increase in recovery, indicated by regression of signs of inflammation and a decrease in the somatic cell counts. Supportive treatment with laser irradiation increased recovery rates by 24.2% (Malinowski, et al., 2019). However, further studies are needed to establish its efficacy by evaluating optimal duration and wavelength combination for mastitis and somatic cell count management.
C) Plant molecule-based compounds:
One of the new tools for mastitis management that is getting attention is called antibiofilm compounds derived from plant molecule-based a non-antibiotic therapy for compounds. Mastitis-causing bacteria form and maintain biofilm through the process of quorum sensing. Bacteria produce biofilms as a survival strategy, especially in challenging environments. Biofilm protects the bacteria as a shield preventing immune cells from directly reaching the bacteria. The plant-based molecules use quorum sensing science to disrupt communication between selected mastitis-causing bacteria (Herrema et al., 2023). The components can block bacterial communication and influence their behavior such as biofilm formation. This process is called quorum quenching or quorum sensing inhibiting. In bacteria, the formation of biofilms is controlled by quorum sensing, QS, signaling genes and their products. Various inhibitors/compounds can disturb the QS signaling cascade and are used as an alternative therapy to optimize biofilm-related challenges. Reducing bacterial QS signaling by proprietarily selected plant molecules is possible because they possess inhibitory activity against bacterial and fungal biofilms. There are claims this technology promotes overall herd health and longevity of cows.
(The plant molecule-based compounds currently being evaluated are produced by AHV International. Some organic dairy producers are reporting varied success with these treatments, but more work is being done to evaluate their use. Bob Whitney)
References:
Blum, S.E., Krifuks, O., Weisblith, L., Fleker, M., Lavon, Y., Zuckerman, A., Hefer, Y., Goldhor, O., Gilad, D., Schcolnic, T. and Leitner, G., 2023. Evaluation of acoustic pulse technology as a non-antibiotic therapy for intramammary infections: Assessing bacterial cure biofilm vs. recovery from inflammation. Frontiers in Veterinary Science, 10, p.1079269.
Gard, J. 2017. Laser Therapy in Food-Animal Practice. Laser Therapy in Veterinary Medicine: Photobiomodulation, 423-430.
Herrema, F., Bieleman, H., Hoekstra, M. and Gomes, J., 2023. Longevity and Milk Production Improvement in Dairy Cows Using Plant-Derived Products. J Vet Heal Sci, 4: 128-140.
Leitner, G., Papirov, E., Gilad, D., Haran, D., Arkin, O., Zuckerman, A. and Lavon, Y., 2021. New treatment option for clinical and subclinical mastitis in dairy cows using Acoustic Pulse Technology (APT). Dairy, 2: 256-269.
Malinowski, E., Krumrych, W. and Markiewicz, H., 2019. The effect of low intensity laser irradiation of inflamed udders on the efficacy of antibiotic treatment of clinical mastitis in dairy cows. Veterinaria italiana, 55: 253-260.
USDA, AMS 2017. National Organic Program (NOP); Organic Livestock. and Poultry Practices. A rule by the Agricultural Marketing Service. The Federal Register.
Revision Note – November 2026: This publication has been substantially revised and expanded to provide updated guidance on soil sampling, interpreting routine soil fertility tests, and evaluating soil health. The revision clarifies the differences between soil fertility and soil health, expands information on the Haney Soil Health Test and aggregate stability, and emphasizes the importance of consistent sampling, laboratory methods, and long-term soil testing records. Additional information on soil biological activity, carbon measurements, and soil testing laboratories has also been updated to help producers make more informed soil management decisions.
Table of Contents
Why Test Soil?
I have taken thousands of soil samples over the years, and one thing I have learned is that a single soil test rarely tells the whole story.
A soil test is a snapshot of what was happening in that soil when the sample was collected. It can tell us a great deal about soil fertility, pH, salinity and other properties, but its value increases tremendously when we sample the same field consistently over time. Then we can begin to see trends. Is phosphorus accumulating? Is soil pH declining? Is salinity becoming a problem? Is soil organic carbon increasing? Are our management practices actually changing the soil?
That is why I encourage producers to think of soil testing as a long-term record rather than simply a fertilizer recommendation.
We also need to distinguish between a routine soil fertility test and the growing number of soil-health tests available today. They answer different questions. A conventional soil test remains the foundation for making nutrient and amendment decisions. Soil-health measurements can add information about soil structure, carbon cycling and biological activity, but they do not replace the basic soil test.
In this publication I will look at how to collect a good soil sample, what common soil tests actually measure, several soil-health tests now available, and some laboratories that producers may want to consider.
A soil test is only as good as the sample that goes to the laboratory. The laboratory may analyze the sample very precisely, but it cannot correct for a poor or unrepresentative sample collected in the field.
The first step is to divide the field into areas that are reasonably uniform. Differences in soil type, slope, drainage, cropping history, irrigation, manure application, or management may justify separate samples. Avoid mixing obviously different areas into one composite sample.
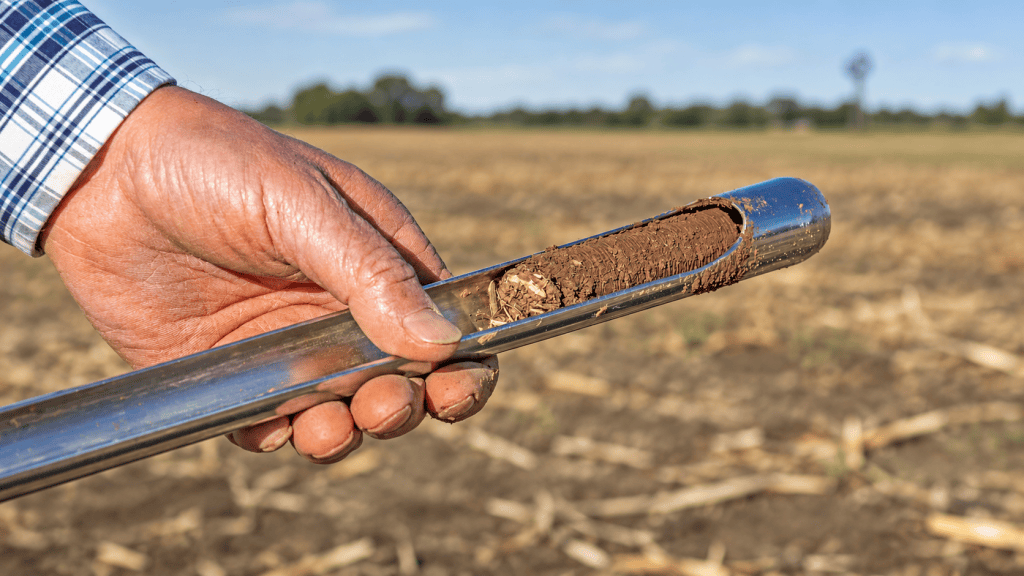
Above is a standard soil probe that will last you for years – well worth the cost.
Within each sampling area, collect multiple soil cores and combine them into one composite sample. The goal is to represent the field or management zone rather than one particular spot. Avoid unusual areas such as field entrances, old fence rows, livestock concentration areas, fertilizer spills, wet spots, or locations close to roads unless those areas are being sampled separately for a specific reason.
Sampling Depth Matters
Use the sampling depth recommended by the laboratory and by the soil-test calibration used for fertilizer recommendations. For many annual crops, routine surface soil samples are commonly collected from approximately the upper 6 inches of soil, although recommended depths vary by crop, region, and laboratory.
Consistency is especially important when comparing results over time. Changing from a 6-inch sample one year to an 8-inch sample the next can change nutrient concentrations simply because a different volume of soil was sampled.
Some nutrients require deeper sampling. Nitrate-nitrogen, for example, can move below the surface soil, so profile sampling may be needed when residual soil nitrate is important for fertilizer recommendations.
Sample Consistently Over Time
If the goal is to monitor changes in the soil, try to sample at approximately the same time of year, at the same depth, and under similar field conditions each time.
This becomes even more important when measuring soil health indicators such as respiration or other biological properties because soil moisture and temperature can strongly influence the results.
Where practical, record sampling locations with GPS or consistently sample the same management zones. Good records make it much easier to determine whether a change in a soil-test result reflects management or simply a change in where the sample was collected.
Use Clean Sampling Equipment
A soil probe or auger usually provides the most consistent sample, but a clean shovel can also be used when necessary. Use clean equipment and a clean plastic bucket for mixing composite samples.
Avoid introducing oils, fertilizers, manure, dust, or other materials that might contaminate the sample. This is particularly important when samples will be analyzed for carbon, micronutrients, biological activity, or contaminants.
Handling the Sample
After the cores are mixed thoroughly, place the amount requested by the laboratory into the appropriate sample container and label it clearly.
Follow the receiving laboratory’s instructions for drying, refrigeration, shipping, and sample preparation. Routine fertility samples and biological soil-health samples may require different handling procedures, so one method should not automatically be used for every type of analysis.
Good soil sampling is not complicated, but consistency matters. If I want to know whether a field is changing over time, I need to make sure I am comparing similar samples collected in similar ways.
A routine agricultural soil test is designed primarily to help us evaluate soil fertility and identify chemical conditions that may limit crop growth. It does not measure every aspect of soil health, but it remains one of the most useful and economical management tools available to farmers.
Depending on the laboratory and the analyses requested, a routine soil test may include soil pH, salinity or electrical conductivity (EC), nitrate-nitrogen, phosphorus, potassium, calcium, magnesium, sulfur, and selected micronutrients. Some laboratories also offer soil organic matter, texture, cation exchange capacity (CEC), or lime requirement as part of the basic package or as optional analyses.
Soil pH
Soil pH tells us how acidic or alkaline the soil is. This matters because pH strongly influences nutrient availability, microbial activity, and the effectiveness of some soil amendments.
An unexpected pH result deserves attention because correcting soil pH across an entire field can be expensive. If a result does not fit the field history or previous soil tests, I would rather verify it with another sample before making a major lime or amendment decision.
Salinity and Electrical Conductivity
Electrical conductivity is an indirect measure of soluble salts in the soil. Elevated salinity can reduce water uptake, interfere with nutrient availability, and injure sensitive crops.
In irrigated areas, greenhouses, high tunnels, dairies, and fields receiving repeated manure or compost applications, salinity deserves particular attention.
Nitrogen
Routine soil tests may measure nitrate-nitrogen, but nitrate is mobile and can change rapidly with rainfall, irrigation, crop uptake, and microbial activity. For this reason, nitrate testing is especially dependent on sampling depth and timing.
Where residual nitrate is important for fertilizer decisions, deeper profile sampling may be more informative than a surface sample alone.
Phosphorus and Potassium
Soil-test phosphorus and potassium are among the most common measurements used to guide fertilizer recommendations.
These tests do not measure all of the phosphorus or potassium present in the soil. Instead, laboratories use specific chemical extractants that have been calibrated against crop response to estimate the portion that is related to plant availability.
This is one reason it is important to know which laboratory and analytical method were used when comparing soil-test results over time.
Secondary Nutrients and Micronutrients
Calcium, magnesium, sulfur, zinc, iron, manganese, copper, boron, and other nutrients may be measured when needed.
Micronutrient results require careful interpretation because soil pH, organic matter, drainage, and crop species can strongly affect whether a measured nutrient is actually available to the plant.
Soil Organic Matter
Many laboratories report soil organic matter, and it can be useful for monitoring long-term changes in soil condition. Organic matter contributes to nutrient cycling, water-holding capacity, aggregation, and biological activity.
However, soil organic matter is not the same thing as soil organic carbon, and the two measurements should not be used interchangeably without understanding how the laboratory determined them.
The Value of Consistency
When I am tracking a field over time, I prefer to use the same laboratory, the same sampling depth, and the same analytical methods whenever possible.
Different laboratories may use different extractants, instruments, reporting units, or interpretation systems. If I switch laboratories, an apparent change in phosphorus, organic matter, or another measurement may reflect a change in method rather than a real change in the field.
The purpose of a routine soil test is not simply to generate numbers. It is to provide information that can guide nutrient management, identify developing problems, and help us make better decisions over time.
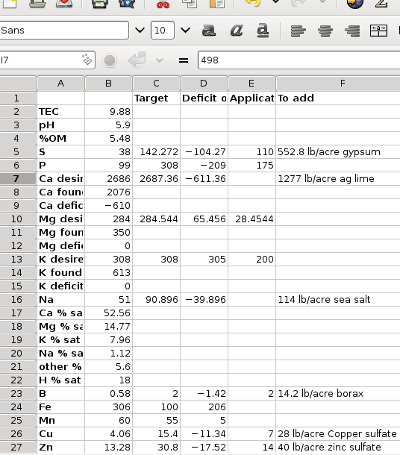
Of course, a normal soil test or what you might call a Regular Soil Test discussed above is a must. These are not usually expensive, +/- $15 or more with micronutrients. This test is of less value to me unless I have previous year’s results to see what is going on. I have taken literally thousands of soil samples and often I will see something show up that is off the charts. I am not known to panic when I see a problem because I am not going to react to that test unless I know it has steadily been a problem that is just getting worse. For instance, we can see pH swings in sand from one year to the next. Before I lime a soil, I may take a second sample just to verify I need lime. $15 soil test is cheaper than $60 per acre lime application.
Soil fertility and soil health are closely related, but they are not the same thing.
Soil fertility focuses mainly on whether the soil can supply the nutrients a crop needs and whether chemical conditions such as pH or salinity may limit growth. A routine soil test is designed primarily to answer these questions.
Soil health is broader. It considers how well the soil functions as a living system. That includes physical properties such as aggregation, compaction, and water movement; chemical properties such as pH, salinity, and nutrient availability; and biological processes such as microbial activity, decomposition, and nutrient cycling.
A soil can be fertile without functioning particularly well as a soil ecosystem. For example, a field may test adequately for phosphorus and potassium but still have poor aggregation, surface crusting, restricted infiltration, or low biological activity. The opposite can also occur: a soil may have active biology and good structure but still have a nutrient deficiency or an unsuitable pH.
That is why I do not view soil health testing as a replacement for routine soil testing. Instead, the two approaches complement each other.
A routine soil test helps answer:
“Do I have the nutrients and chemical conditions needed to grow this crop?”
Soil health measurements help answer:
“How well is this soil functioning, and is that function improving or declining over time?”
As interest in soil health has increased, laboratories have developed many additional measurements, including soil respiration, soil organic carbon, aggregate stability, active or labile carbon, biologically available nitrogen, phospholipid fatty acid analysis (PLFA), and DNA-based microbial testing.
These tests can provide useful information, but they do not all measure the same thing. Understanding what each test actually measures is more important than simply ordering a large soil health package and receiving a single score.
The next sections look at several of these measurements and how they can fit alongside a routine soil fertility test.
The Haney Soil Health Test was developed to provide additional information about biologically active carbon and nitrogen pools and microbial activity in soil. It does not replace a conventional soil fertility test; instead, it helps answer some different questions about how carbon and nutrients are cycling through the soil.
One of the best-known measurements associated with the Haney approach is soil respiration. A dried soil sample is rewetted and the carbon dioxide released during a defined incubation period is measured. This CO₂ release reflects microbial activity as soil organisms begin using available carbon after rewetting.
The Haney approach also measures water-extractable organic carbon (WEOC) and water-extractable organic nitrogen (WEON). These represent relatively soluble portions of the soil organic carbon and nitrogen pools that can participate in biological cycling.
Understanding a Haney Soil Health Test Report
A Haney Soil Health Test report provides several measurements related to soil biological activity, carbon and nitrogen cycling, and nutrient availability. The exact information reported depends on the laboratory and the analytical package selected.
Three measurements are particularly important:
Soil respiration (CO₂-C burst): Estimates potential microbial activity following rewetting and incubation.
Water-extractable organic carbon (WEOC): Measures a soluble carbon pool that may provide energy for soil microorganisms.
Water-extractable organic nitrogen (WEON): Measures water-extractable organic nitrogen that may participate in microbial nitrogen cycling and subsequent mineralization.
These three measurements are also used to calculate the Haney Soil Health Score. The score summarizes selected biological indicators, but it should not be interpreted as a complete measurement of soil health. Soil structure, water infiltration, compaction, and other important soil properties are not directly included.1
Depending on the laboratory, a Haney report may also provide pH, electrical conductivity, nitrate and ammonium nitrogen, extractable phosphorus and potassium, other nutrients, and estimates of potentially mineralizable nitrogen. Some laboratories provide additional conventional analyses or fertilizer recommendations.
An important distinction is that the Haney test uses water extractions and the H3A extractant for certain nutrient measurements. These results are not necessarily equivalent to those obtained using conventional soil-test methods calibrated for fertilizer recommendations.
**For making fertilizer decisions, I prefer to use regionally calibrated soil fertility recommendations while treating Haney measurements as additional information about soil carbon and nitrogen cycling.**2
Example of a Haney Soil Health Test report showing biological activity, water-extractable carbon and nitrogen, and other soil measurements. Report components and interpretations may vary among laboratories.
I encourage producers to examine the individual measurements rather than concentrating only on the Soil Health Score. Consistent sampling, comparable laboratory methods, and results collected over several years are more useful for evaluating management changes than a single report.
It is important not to confuse these measurements with the conventional nutrient extractions used for fertilizer recommendations. A routine soil test and a Haney-type test are measuring different soil pools and answering different management questions.
The Haney measurements can be particularly useful when I want to monitor changes associated with practices such as cover crops, reduced tillage, manure or compost applications, crop rotations, or other practices intended to increase biological activity and carbon cycling.
However, a single Haney Soil Health Score should not be treated as a complete description of soil health. Soil texture, climate, cropping system, sampling conditions, and inherent soil properties all influence biological measurements. I place more value on the individual measurements and how they change over time than on comparing one overall score among very different soils.
The Haney approach has also become more closely connected with current USDA soil-health testing. NRCS now recognizes water-extractable organic carbon as an alternative method for measuring labile carbon and water-extractable organic nitrogen as an alternative method for measuring bioavailable nitrogen under its CEMA 216 Soil Health Testing framework.3
That does not mean the Haney test measures everything we need to know about soil health. It does mean that several of its measurements provide useful information about important biological processes when they are interpreted alongside routine soil fertility tests and other physical and biological indicators.
One of the most useful physical measurements of soil health is aggregate stability.
Soil particles naturally bind together into groups called aggregates. These aggregates create pore spaces that allow water and air to move through the soil and provide pathways for roots. Good aggregation is one reason a well-structured soil can absorb rainfall rather than sealing over and producing runoff.
Aggregate stability measures how well those soil aggregates resist breaking apart when they are exposed to water or other physical forces.4
This matters because unstable aggregates can break down during rainfall or irrigation. Fine particles may then clog surface pores, form a crust, reduce infiltration, and increase runoff and erosion. A soil may contain adequate nutrients and still perform poorly if its physical structure has deteriorated.
What Helps Build Stable Aggregates?
Aggregate stability develops through a combination of physical, chemical, and biological processes.
Plant roots help bind soil particles and create channels through the soil. Fungal hyphae can physically connect particles, while bacteria and other microorganisms produce compounds that help bind particles together. Organic matter also plays an important role in forming and stabilizing aggregates.
Management practices can therefore influence aggregate stability. Crop rotations, cover crops, living roots, organic amendments, and reduced soil disturbance may help improve aggregation over time. Intensive tillage, low residue return, erosion, and other disturbances can weaken soil structure.
Soil type also matters. A sandy soil naturally behaves very differently from a clay soil, so aggregate stability should not be interpreted without considering texture, mineralogy, climate, and management history.
How Is Aggregate Stability Measured?
There are several ways to measure how well soil aggregates resist breaking apart when exposed to water. Some methods are simple enough for farmers to use themselves, while others require specialized laboratory equipment. The methods differ in how water is applied and how aggregate breakdown is measured, so their results are not necessarily interchangeable.
Slaking Image Analysis — The SLAKES Smartphone App
One of the easiest methods for farmers to use is the free SLAKES smartphone application developed by the Soil Health Institute.
The procedure involves placing three dry soil aggregates into water and using a smartphone camera to photograph how they change over a 10-minute period. The application analyzes the images and calculates an aggregate stability index.
I particularly like this approach because farmers can use it themselves without expensive laboratory equipment. It provides a practical way to compare soil from different fields, management practices, or locations within a field, although soil type and sample preparation must be considered when interpreting the results.
The application also makes an excellent teaching tool. Farmers can actually watch soil aggregates break apart or remain intact when exposed to water.
The Cornell Soil Health Laboratory uses a rainfall simulation approach to evaluate wet aggregate stability. A known quantity of soil aggregates is placed on a sieve and exposed to water droplets from a rainfall simulator.
Aggregates that break apart pass through the sieve, while the material remaining is used to calculate the percentage of water-stable aggregates.
This approach is especially useful because it simulates the impact of raindrops on soil aggregates, one of the processes contributing to surface sealing, crusting, and erosion.
Wet Sieving Procedure
Wet sieving is a widely used laboratory approach for measuring aggregate stability. Soil aggregates are placed on sieves and exposed to water, often with controlled movement of the sieves.
The amount and size distribution of aggregates remaining after the procedure are used to evaluate stability.
Wet sieving can provide quantitative measurements for comparing treatments and tracking changes over time. However, the results depend on details such as sample preparation, sieve sizes, wetting procedures, and agitation, making consistent methods particularly important.
Mean Weight Diameter (MWD)
Mean weight diameter is not a separate testing procedure but a calculated measurement commonly obtained from aggregate size distribution following wet sieving.
It represents the weighted average diameter of the aggregate fractions remaining after testing. A larger MWD generally indicates that larger aggregates have remained intact, although interpretation depends on the soil and testing method.
MWD is frequently used in soil research to compare management practices and evaluate changes in soil structure.
Which Method Should Farmers Use?
For farmers interested in learning about aggregate stability without sending samples to a laboratory, I would begin with the SLAKES application. It is inexpensive, relatively easy to use, and provides a way to observe the physical behavior of soil aggregates.
For research trials or long-term monitoring programs requiring standardized quantitative measurements, laboratory methods may be more appropriate.
Regardless of the method, I would emphasize collecting comparable samples, following the same procedure each time, and interpreting results in the context of soil texture and management history.
Why I Like This Measurement
Aggregate stability tells us something that a conventional nutrient test cannot.
A routine soil test may tell me that phosphorus, potassium, and pH are all within acceptable ranges. Aggregate stability helps tell me whether the soil itself has the physical structure needed to accept water, resist erosion, and support roots.
For that reason, I think aggregate stability is one of the more practical soil-health measurements available. It connects a laboratory number with something farmers can often see in the field after a hard rain: does water enter the soil, or does the surface seal and the water run off?
Like most soil-health measurements, aggregate stability is most useful when it is followed over time and compared with similar soils under similar conditions.
Soil Organic Carbon: A Long-Term Measure of Soil Health
Soil organic carbon (SOC) is one of the most important measurements we can use to evaluate long-term changes in soil health. Carbon enters the soil primarily through plant roots, crop residues, cover crops, and organic amendments such as manure and compost. Some of that carbon is rapidly decomposed by soil organisms, while other portions can remain in the soil for years or even decades.5
Soil organic carbon is closely associated with many of the functions we want from a healthy soil.6 It contributes to aggregate formation and stability, supports microbial activity and nutrient cycling, and can improve water-holding capacity. Increasing soil carbon is often an important goal of regenerative and organic production systems.
Soil Organic Carbon Is Not the Same as Soil Organic Matter
Many farmers are familiar with soil organic matter (SOM) because it has been reported on soil tests for decades. However, soil organic matter and soil organic carbon are not the same measurement.
Soil organic matter includes carbon along with oxygen, hydrogen, nitrogen, sulfur, and other elements found in decomposed plant and animal materials. Soil organic carbon measures only the carbon portion of that organic material.
Historically, soil organic matter has often been estimated by multiplying soil organic carbon by 1.724, based on the assumption that organic matter contains approximately 58% carbon.7 However, the carbon content of soil organic matter varies among soils, so this conversion is only an approximation.
When monitoring changes through time, it is important to know whether the laboratory reports measured organic carbon, measured organic matter, or a value calculated from another measurement.
How Is Soil Organic Carbon Measured?
Dry combustion is a widely accepted method for measuring soil carbon. However, the laboratory must distinguish organic carbon from inorganic carbon, particularly in calcareous soils containing calcium carbonate. Depending on the analytical procedure, this may involve removing or separately determining inorganic carbon.8
For this reason, I want to know whether my laboratory is reporting total carbon or specifically soil organic carbon, particularly when working with calcareous soils.
Why Soil Organic Carbon Changes Slowly
Unlike soil nitrate or microbial respiration, soil organic carbon generally changes slowly. Even when management practices improve soil carbon storage, detecting those changes through routine soil sampling can be difficult. Research by Wuest and Durfee (2024) demonstrated substantial variation in soil organic carbon measurements between sampling dates, emphasizing that small differences between individual soil tests may not represent meaningful changes in soil carbon.9 For this reason, I place greater confidence in carefully collected measurements over several years than in comparisons between just two sampling dates.
In many agricultural fields, measurable changes may require several years or longer. Small differences between annual soil tests may reflect normal sampling and laboratory variability rather than a real change in soil carbon.
For that reason, I generally view soil organic carbon as a long-term measurement rather than something that needs to be tested every year. Establishing a reliable baseline and repeating the measurement at consistent intervals, perhaps every three to five years, may be more useful for many producers.
Carbon Concentration Versus Carbon Storage
There is another important distinction. A laboratory usually reports soil organic carbon as a concentration, often expressed as a percentage of the dry soil.
That percentage is not the same as the total amount of carbon stored in a field.
To estimate carbon storage per acre, we also need to know the soil depth and bulk density, which describes the mass of dry soil within a given volume. This distinction becomes especially important when comparing tilled and no-till soils because changes in soil density can affect carbon storage calculations.10
What I Want Farmers to Remember
I would not judge the success of a soil management program by whether soil organic carbon increased a small amount in a single year. I would look for a consistent trend over time, supported by other measurements such as aggregate stability, infiltration, and biological activity.11
Soil organic carbon is an important indicator of soil condition, but it is not a complete soil-health measurement by itself. A field may have relatively low organic carbon because of its texture and climate yet still be functioning well for that particular soil.
The goal is to understand the soil we have, measure it consistently, and determine whether our management is improving its ability to support productive agriculture over time.
Soil is a living system, and the organisms living in it are constantly using carbon as an energy source. As microorganisms decompose crop residues, roots, and soil organic matter, they release carbon dioxide (CO₂) through respiration. Plant roots and soil animals also contribute to total soil respiration.
Measuring soil respiration provides information about biological activity and the decomposition processes involved in nutrient cycling. Unlike soil organic carbon, which measures a relatively large pool of carbon stored in the soil, respiration measures carbon being released through biological processes.12
How Is Soil Respiration Measured?
Several methods are used to measure soil respiration. Some measure CO₂ released directly from soil in the field, while others use soil samples incubated under controlled laboratory conditions.13
One commonly used laboratory method is the 24-hour CO₂ burst test, which is associated with the Haney Soil Health Test. A soil sample is dried, rewetted, and incubated under controlled conditions. The CO₂ released during the following 24 hours is measured as an indicator of potential microbial activity.
Rewetting dry soil often produces a rapid increase in microbial respiration as microorganisms respond to the availability of water and organic substrates. Research has demonstrated that this CO₂ flush is related to biologically active soil organic matter and other indicators of soil microbial activity.14
Other laboratory methods use longer incubation periods, such as three or four days. Because incubation time, temperature, moisture, and measurement procedures can influence the results, values obtained using different methods should not be assumed to be directly comparable.15
Does Higher Respiration Mean Healthier Soil?
Not necessarily.
Higher respiration under standardized laboratory conditions often indicates greater potential microbial activity or more readily decomposable organic material. However, respiration also represents carbon being released from the soil as CO₂.
For example, tillage can temporarily stimulate microbial activity by exposing previously protected organic matter to decomposition. The resulting increase in respiration does not necessarily mean that soil health has improved.
Likewise, low respiration may reflect limited organic material, but it can also result from unfavorable conditions such as drought, excessive moisture, or low temperatures.
I would be cautious about assigning universal ratings of good or poor soil health based on a single respiration measurement. Soil texture, carbon content, management history, and analytical methods all affect the results.16
Why I Find Respiration Useful
Soil respiration provides information that a conventional fertility test cannot. It helps us understand how actively microorganisms are processing organic material and participating in carbon and nutrient cycling.
For organic and regenerative producers, respiration measurements may be useful for monitoring changes associated with cover crops, crop rotations, organic amendments, and reduced tillage.
However, I would not use respiration alone to judge whether a management practice is improving soil health. I would interpret it alongside soil organic carbon, aggregate stability, routine fertility measurements, and the history of the field.
Soil organic carbon tells us something about the carbon stored in the soil. Soil respiration tells us something about the biological activity using that carbon. Both measurements are useful, but neither tells the complete story.
As with other soil-health indicators, the greatest value comes from consistent sampling, comparable laboratory methods, and measurements collected over time.
Advanced Soil Biological Testing: PLFA and DNA Analysis
Soil microorganisms play essential roles in decomposing organic matter, cycling nutrients, forming soil aggregates, and interacting with plant roots. While soil respiration provides a general measurement of biological activity, other laboratory tests can provide information about the size and composition of soil microbial communities.
Two approaches used in soil research and commercial soil testing are phospholipid fatty acid (PLFA) analysis and DNA-based microbial testing. These methods provide different types of information, and neither should be considered a complete measurement of soil health.
Phospholipid fatty acids are important components of microbial cell membranes. Different microbial groups contain characteristic fatty acids, and laboratory analysis of these compounds can provide estimates of microbial biomass and broad differences in community composition.
PLFA analysis generally involves extracting lipids from a soil sample, separating the fatty acids, and measuring them using specialized laboratory instruments.
Because phospholipids break down relatively quickly after microorganisms die, PLFA analysis is commonly used as an indicator of the living microbial community rather than the total microbial material present in soil.17
What Can PLFA Tell Us?
PLFA results may include estimates of total microbial biomass, bacterial and fungal biomass, and the relative abundance of broad microbial groups.18
These measurements can help researchers evaluate how soil microbial communities respond to crop rotations, cover crops, tillage, organic amendments, and other management practices.
For example, a long-term cropping experiment might use PLFA to determine whether microbial biomass or community composition changes following the introduction of cover crops or reduced tillage.
Some laboratories also report a fungal-to-bacterial ratio. While changes in this ratio may reflect differences in soil conditions or management, there is no universal ratio that defines a healthy agricultural soil.
PLFA does not ordinarily identify individual microbial species, and it does not directly measure whether microorganisms are actively performing particular functions such as nitrogen fixation or phosphorus mineralization.19
Limitations of PLFA Testing
Microbial communities respond rapidly to environmental conditions, including soil moisture, temperature, plant growth, and recent management activities.
For this reason, PLFA measurements can vary considerably between sampling dates. Sample handling and storage are also particularly important because microbial lipids can change or degrade after collection.
PLFA is useful for research and for monitoring changes in microbial communities under controlled sampling conditions. However, I would not recommend it as a routine replacement for conventional soil testing or the more established soil-health indicators.
For most producers, the additional cost and difficulty of interpreting the results should be considered before ordering this analysis.
DNA-Based Soil Microbial Testing
DNA-based soil testing uses genetic information extracted from soil to characterize microorganisms and, depending on the analytical method, identify particular organisms or genes associated with biological functions.
Unlike PLFA, which characterizes broad microbial groups through cell-membrane lipids, DNA sequencing can provide much greater detail about the organisms represented in a soil sample.
Some commercial services use this technology to assess microbial communities, detect genetic signatures associated with plant pathogens, or evaluate genes involved in nutrient cycling.
One example is Trace Genomics, whose technology and products were acquired by Miraterra in July 2025. The company has developed soil analysis services combining genomic information with conventional soil chemistry and agronomic interpretation.20
What Can DNA Testing Actually Tell Farmers?
DNA testing can be especially useful when there is a specific question, such as whether a soil contains genetic evidence of a particular plant pathogen or whether management practices are associated with changes in microbial community composition.
However, detecting an organism or a gene does not necessarily mean that the organism is alive, actively performing that function, or affecting crop growth under current field conditions.
For example, detecting genes associated with phosphorus solubilization indicates biological potential, but it does not establish how much phosphorus is actually being released and made available to a growing crop.
Similarly, detecting DNA from a plant pathogen does not necessarily mean that disease will develop. Disease depends on a susceptible host, a capable pathogen, and environmental conditions favorable for infection.
These technologies are advancing rapidly, but interpretation remains challenging. For most producers, DNA-based analyses are likely to be most useful when addressing a specific management or plant-health question rather than as a routine annual soil-health measurement.21
I encourage farmers to begin with the question they are trying to answer.
If I want to know whether biological carbon cycling is changing, soil respiration may be a useful starting point.
If I want to study changes in microbial biomass or broad community composition, PLFA may provide additional information.
If I am investigating particular microorganisms, soilborne pathogens, or microbial genes, DNA-based testing may be more appropriate.
The most expensive or technologically advanced test is not necessarily the most useful. The value of any soil test depends on whether its results help us understand the soil and make better management decisions.
Great publication you can read on understanding these Soil Health Tests. Just click the link below:
The “take home” message is not soil testing only, but records of soil tests you can see over time!
Putting Soil Testing to Work
After years of collecting soil samples and working with producers, I have come to appreciate that the value of soil testing is not simply the number of measurements we can obtain. It is understanding what those measurements tell us and how we can use them to make better management decisions.
For most producers, I would begin with a good routine soil fertility test. If I want to understand changes in soil health, I might add measurements such as soil organic carbon, aggregate stability, or biological activity. More specialized tests, including PLFA and DNA analysis, may be useful when there is a specific question about the soil microbial community.
Regardless of the tests selected, consistent sampling and good records are essential. A single soil test provides useful information, but a series of comparable tests can help us recognize trends, evaluate management practices, and identify developing problems.
The goal is not to collect more soil-test numbers. The goal is to understand our soil well enough to manage it better.
Bellows, B., Morris, M., & Mitchell, C. (2020). Soil Health Indicators and Tests.ATTRA Sustainable Agriculture, Publication IP603. National Center for Appropriate Technology. ↩︎
USDA Natural Resources Conservation Service. (2026). Soil Health Testing. Conservation Evaluation and Monitoring Activity (CEMA) 216, January 2026R. U.S. Department of Agriculture. ↩︎
USDA Natural Resources Conservation Service. (2026). Soil Health Testing. Conservation Evaluation and Monitoring Activity (CEMA) 216, January 2026R. U.S. Department of Agriculture. ↩︎
USDA Natural Resources Conservation Service. (2026). Soil Health Testing. Conservation Evaluation and Monitoring Activity (CEMA) 216, January 2026R. U.S. Department of Agriculture. ↩︎
USDA Natural Resources Conservation Service. (n.d.). Soil Health Assessment. U.S. Department of Agriculture. ↩︎
USDA Natural Resources Conservation Service. (2026). Soil Health Testing. Conservation Evaluation and Monitoring Activity (CEMA) 216, January 2026R. U.S. Department of Agriculture. ↩︎
USDA Natural Resources Conservation Service. (2026). Soil Health Testing. Conservation Evaluation and Monitoring Activity (CEMA) 216, January 2026R. U.S. Department of Agriculture. ↩︎