Smart Sensing in Organic Systems: How Drones, Satellites, and Sensors Help Detect Crop Stress Before It Happens

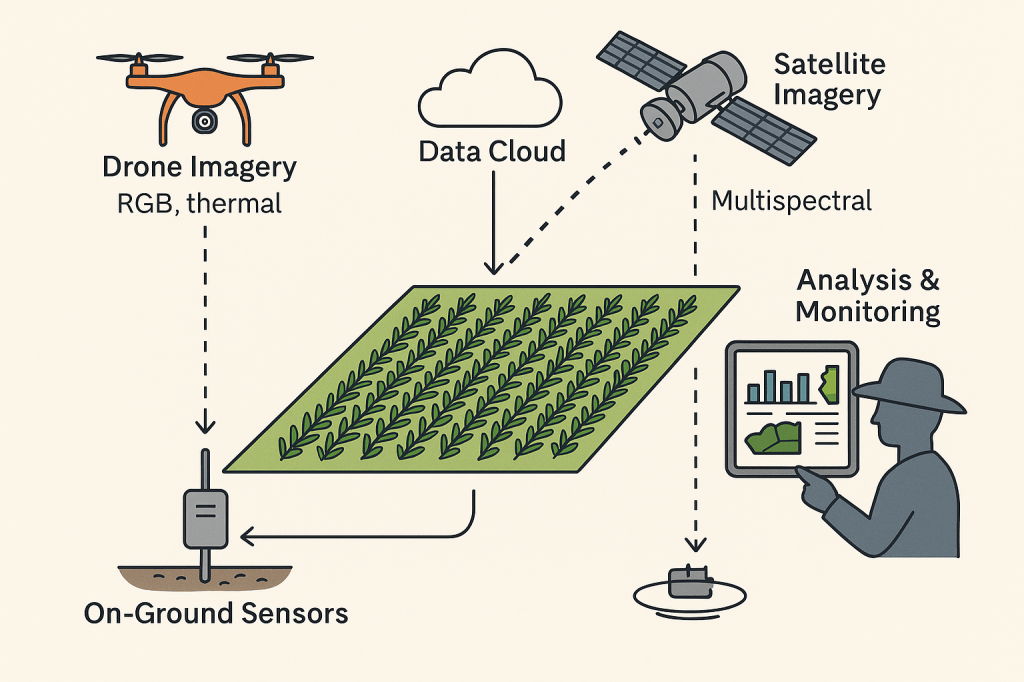
Smart sensing is transforming how we understand plant health in organic systems. By integrating satellite and drone imagery, in-field sensors, and artificial intelligence, we can now detect stress in crops long before symptoms appear. This technology doesn’t replace the farmer’s eye—it strengthens it, helping us protect soil biology, use resources more wisely, and make better management decisions.

Learning from Students and Staying Curious

This past Saturday (October 18), a group of high school students invited me to speak about their project on smart plant monitoring. They were designing a device to track plant health in real time. Their questions—about soil, light, and water—were sharp and curious. It reminded me why I love this field: whether we’re students or seasoned farmers, we’re all learning how to listen to plants a little better.

Their project also made me reflect on how far we’ve come. When I started in Extension, plant monitoring meant walking fields, taking notes, and maybe digging a soil sample. Now, we’re using satellites orbiting hundreds of miles above the earth and sensors no bigger than a pencil eraser to understand how crops respond to their environment.

From Satellites to Soil: The New Eyes of Agriculture

In organic production, timing is everything. A crop under stress can lose days of growth before we even notice it. But RGB drone and satellite imaging now allow us to spot stress early by detecting subtle changes in leaf color, canopy density, or reflectance.

Even more advanced are multispectral and hyperspectral sensors, which measure how plants reflect light across visible and infrared wavelengths. These patterns can reveal water stress, nitrogen deficiency, or disease pressure—well before a plant wilts or yellows.1

Thermal cameras add another layer. Drought-stressed plants reduce transpiration, causing leaf temperature to rise—a change that infrared sensors can detect long before visible damage occurs.2

Once the imagery is captured, we still rely on ground-truthing—walking to the coordinates, checking the crop, soil, and often pulling tissue samples. This blend of technology and touch keeps data meaningful.

Predictive Systems: Seeing Stress Before It Starts

The most exciting progress in recent years has been predictive capability. AI-powered analytics now integrate drone imagery, IoT soil data, and weather patterns to learn what “normal” looks like for a crop. When the system detects deviations—like a drop in chlorophyll fluorescence or a rise in leaf temperature—it flags them early.3

One powerful method is solar-induced chlorophyll fluorescence (SIF), which measures photosynthetic efficiency. Subtle declines in fluorescence intensity can indicate stress from drought, salinity, or nutrient imbalance days before the plant shows visible symptoms.4

Meanwhile, IoT sensor networks are spreading across fields. These small devices monitor soil moisture, pH, canopy temperature, and even sap flow, sending real-time data to cloud dashboards that can automatically adjust irrigation schedules.5

This isn’t just smart—it’s proactive agriculture.

Image acquisition setups using different sensors (i) DJI Matrice 600 Pro with a Sony Alpha 7R II, 42.4-megapixel RGB camera mounted on it(Sapkota, 2021), (ii) A close-range laboratory imaging system with a Micro-Hyperspec VNIR sensor in controlled lighting condition (Dao et al., 2021a), (iii) HyperCam on the tripod, Fluke TiR1, Lci leaf porometer, Infragold as well as dry and wet references targets (Gerhards et al., 2016) (iv) Chamber equipped with two Raspberry Pi 3B + and an ArduCam Noir Camera with a motorized IR-CUT filter and two infrared LEDs (Sakeef et al., 2023).6

Why This Matters for Organic Systems

Organic farming depends on living systems—soil microbes, organic matter, and ecological balance. Unlike conventional systems, we can’t rely on quick chemical fixes. We need to detect stress early enough to respond biologically—through irrigation management, microbial inoculants, or balanced foliar nutrition.

Smart sensing tools help us manage that complexity. When we combine spectral imagery, soil data, and climate information, we begin to see the farm as an interconnected ecosystem rather than a collection of separate fields.

Monitoring also supports stewardship. Water-quality sensors can now detect salinity and bicarbonate buildup that harm roots over time. Linking those readings with AI-derived stress maps helps producers align soil chemistry, water quality, and plant physiology in one continuous feedback system.7

The Human Element Still Matters

Even with all this technology, the farmer’s experience is irreplaceable. Data can tell us something changed, but it takes experience to know why. Was that NDVI dip caused by poor drainage, pests, or a timing issue in irrigation?

Technology should not distance us from the field—it should bring better insight to our decisions. As I often tell growers, just as computers need rebooting, we occasionally need to “reboot” our interpretation—to align the data with what we know from hands-on experience.

A Partnership Between Grower, Plant, and Sensor

When those students asked how technology fits into farming, I told them this: smart monitoring doesn’t make agriculture less human—it makes it more informed.

The future of organic production is a partnership between the grower, the plant, and the sensor. When all three communicate clearly, we grow more than crops—we grow understanding. And in that understanding lies the future of any sustainable agriculture.

Further Reading

References

  1. Dutta, D. et al. (2025). “Hyperspectral Imaging in Agriculture: A Review of Advances and Applications.” Precision Agriculture, 26(3): 445–463. ↩︎
  2. Cendrero-Mateo, M.P. et al. (2025). “Thermal and Spectral Signatures of Plant Stress.” Frontiers in Plant Science, 16:31928. https://doi.org/10.3389/fpls.2025.1631928 ↩︎
  3. Chlingaryan, A. et al. (2025). “Machine Learning for Predictive Stress Detection in Crops.” Computers and Electronics in Agriculture, 218:107546. https://www.sciencedirect.com/science/article/pii/S0168169924011256 ↩︎
  4. Guanter, L. et al. (2024). “Solar-Induced Fluorescence for Assessing Vegetation Photosynthesis.” NASA Earthdata Training Series. https://www.earthdata.nasa.gov/learn/trainings/solar-induced-fluorescence-sif-observations-assessing-vegetation-changes-related ↩︎
  5. Ahmad, L. & Nabi, F. (2024). Agriculture 5.0: Integrating AI, IoT, and Machine Learning in Precision Farming. CRC Press. ↩︎
  6. Chlingaryan, A. et al. (2025). “Machine Learning for Predictive Stress Detection in Crops.” Computers and Electronics in Agriculture, 218:107546. https://www.sciencedirect.com/science/article/pii/S0168169924011256 ↩︎
  7. Gómez-Candón, D. et al. (2025). “Integrating Water Quality Sensors and Remote Sensing for Sustainable Irrigation.” Agricultural Water Management, 298:108072. ↩︎

Rogers’ Adoption Curve: Utilization in Teaching Organic Agriculture

In my career as an Extension professional (extension agent, researcher, specialist) I have had a lot of agriculture training, but I have also had a lot of training for training agriculturists which includes just about every group in agriculture today.  One of the early lessons we learned was a simple theory about learning called the Rogers’ Adoption Curve.

I couldn’t begin to tell you much about Rogers or his overall work as an educator, but I do know about this curve and in my career this “curve” has proven to be true over and over again.  What you see in this picture is the classic “bell curve” representing the concept of knowledge or technology.  People who adopt new knowledge or technologies are represented along the bottom axis and the progression is from left to right, i.e. the first to adopt are on the left and over time the others adopt the technology.  So, looking at this we see that the first group to adopt the technology are innovators followed by early adopters and so on.  This picture shows a break called “The Chasm” between early adopters and early majority.  This chasm is difficult to cross and can represent a lot of time or even failure for the technology. 

Organic farmers are mostly in the innovator/early adopter category.  Organic agriculture is not easy and in general requires a good knowledge of agriculture systems before getting into the details of growing organic.  As an extension educator I tend to try and find innovators and early adopters to work on demonstration or research projects because I know they are just as anxious to explore new technologies as I am. 

That said, let me ask you where you are today?  Occasionally we need to take a break and get away from it all because we are falling into the late majority or laggard category doing the same thing we always did.  Don’t lag too far behind because as you can tell from the “curve” there are a lot of people already on the downhill slide!

Using the Curve!

Rogers’ Adoption Curve is a model that outlines the adoption process of new technologies or ideas through different segments of a population. Developed by Everett Rogers in 1962, it’s widely used in the fields of social science, marketing, and innovation management but is very useful in organic agriculture too.

Rogers’ Adoption Curve is an effective tool for understanding how new practices, like organic agriculture, are adopted within a community. Extension professionals can use this model to tailor their educational and promotional strategies for organic agriculture to different segments of the agricultural community.

  1. Innovators (2.5% of the Population)

Characteristics: These are the first individuals to adopt an innovation. They are risk-takers, have financial liquidity, are social networkers, have closer contact with scientific sources and interaction with other innovators.

Role in Adoption: Their acceptance of an innovation is a key step in the process. Being a small segment, they serve as a testing ground and are crucial in initial debugging or refinement of the product or idea.

Targeting Innovators

  • Approach: Provide detailed, technical information on organic agriculture, focusing on innovation and environmental benefits.
  • Why: Innovators are keen to experiment with new techniques and can provide valuable feedback.
  • Example: Conducting pilot projects with innovators to demonstrate the efficacy of organic practices.

2. Early Adopters (13.5% of the Population)

Characteristics: This group has the highest degree of opinion leadership among the other adopter categories. They are typically younger, more socially forward, and have a higher social status and more financial lucidity.

Role in Adoption: Early adopters are crucial for the validation and initial dissemination of the innovation. Their acceptance acts as an endorsement, influencing the next wave of adopters.

Engaging Early Adopters

  • Approach: Emphasize the social and economic benefits of organic agriculture. Use early adopters as role models.
  • Why: Early adopters have strong influence over their peers. Their success stories can inspire others.
  • Example: Showcasing successful organic farms managed by early adopters in workshops and field days.

3. Early Majority (34% of the Population)

Characteristics: They adopt an innovation after a varying degree of time. This period is significantly longer than the innovators and early adopters. They are typically more deliberate before adopting a new idea, often influenced by interactions with peers.

Role in Adoption: Their adoption is a pivotal point in the lifecycle of an innovation, marking the moment when an innovation reaches a critical mass of users.

Convincing the Early Majority

  • Approach: Focus on practicality and the mainstream benefits of organic farming. Provide evidence of success from early adopters.
  • Why: The early majority are cautious and need proof of effectiveness.
  • Example: Organizing farm tours to successful organic farms and creating user-friendly guides.

4. Late Majority (34% of the Population)

Characteristics: This group is skeptical about change and will only adopt an innovation after the majority of society has embraced it. They typically have below-average social status and financial liquidity.

Role in Adoption: Their adoption signifies the innovation has become mainstream. They usually require external pressures from peers or societal changes for adoption.

Addressing the Late Majority

  • Approach: Use peer pressure and economic incentives. Highlight the risks of not adopting organic practices.
  • Why: Late Majority are skeptical and influenced by the norms established by the majority.
  • Example: Offering financial assistance or subsidies for transitioning to organic farming.

5. Laggards (16% of the Population)

Characteristics: They are the last to adopt an innovation. Unlike some of the previous categories, they aren’t looking for information on new ideas and are focused on traditions. They tend to be of an older age, lower in social status, and less financially fluid.

Role in Adoption: Their adoption is usually not vital for the overall success of an innovation but signifies complete market saturation.

Reaching Laggards

  • Approach: Use personal relationships and focus on tradition and security aspects of organic farming.
  • Why: Laggards are resistant to change and trust familiar faces and traditional methods.
  • Example: One-on-one meetings, focusing on how organic farming aligns with traditional farming values.

Importance in Agriculture Extension and Teaching Organic

In the context of agriculture extension, understanding Rogers’ Adoption Curve is vital. It helps in identifying the right strategies to promote new agricultural practices or technologies. By recognizing the characteristics and motivations of each group, extension professionals can tailor their approach, ensuring that innovations are adopted effectively across different segments of the farming community.

For example, introducing organic farming techniques or new sustainable practices can follow this curve. Innovators might experiment with these techniques first, followed by early adopters who validate and popularize them. As these practices gain credibility, they gradually become adopted by the majority.

  • Tailored Communication: Develop different communication strategies for each group. Innovators and early adopters might prefer digital communication, whereas late majority and laggards may respond better to traditional methods like community meetings.
  • Feedback Loops: Establish feedback mechanisms with each group. Innovators can provide technical feedback, whereas the majority can give insights into mainstream acceptance.
  • Continual Education: Offer ongoing support and education, adapting to the changing needs and responses of each group.

Conclusion

Rogers’ Adoption Curve provides a framework to understand how innovations like organic agriculture spread within a community. This understanding is crucial for professionals in fields like agriculture extension, where the goal is to implement new, often more sustainable, practices and technologies. By catering to the unique characteristics and needs of each adopter category, the adoption process can be more efficient and widespread.

By understanding and applying Rogers’ Adoption Curve, we can more effectively promote organic agriculture. Tailoring strategies to each segment of the adoption curve ensures that communication and education are relevant and engaging, increasing the likelihood of widespread adoption of organic practices. This approach not only aids in the dissemination of organic farming methods but also ensures a supportive community (the organic family) is built around these practices.