On Thursday, July 31, 2025, the Texas A&M AgriLife Research Halfway Station hosted a Hi-A Corn Breeding and Genetics Field Tour and Research Forum that brought together around 30 participants, including farmers, researchers, seed companies, and agricultural lenders. The event highlighted the exciting potential of Hi-A (high anthocyanin) corn varieties in both production and food markets.

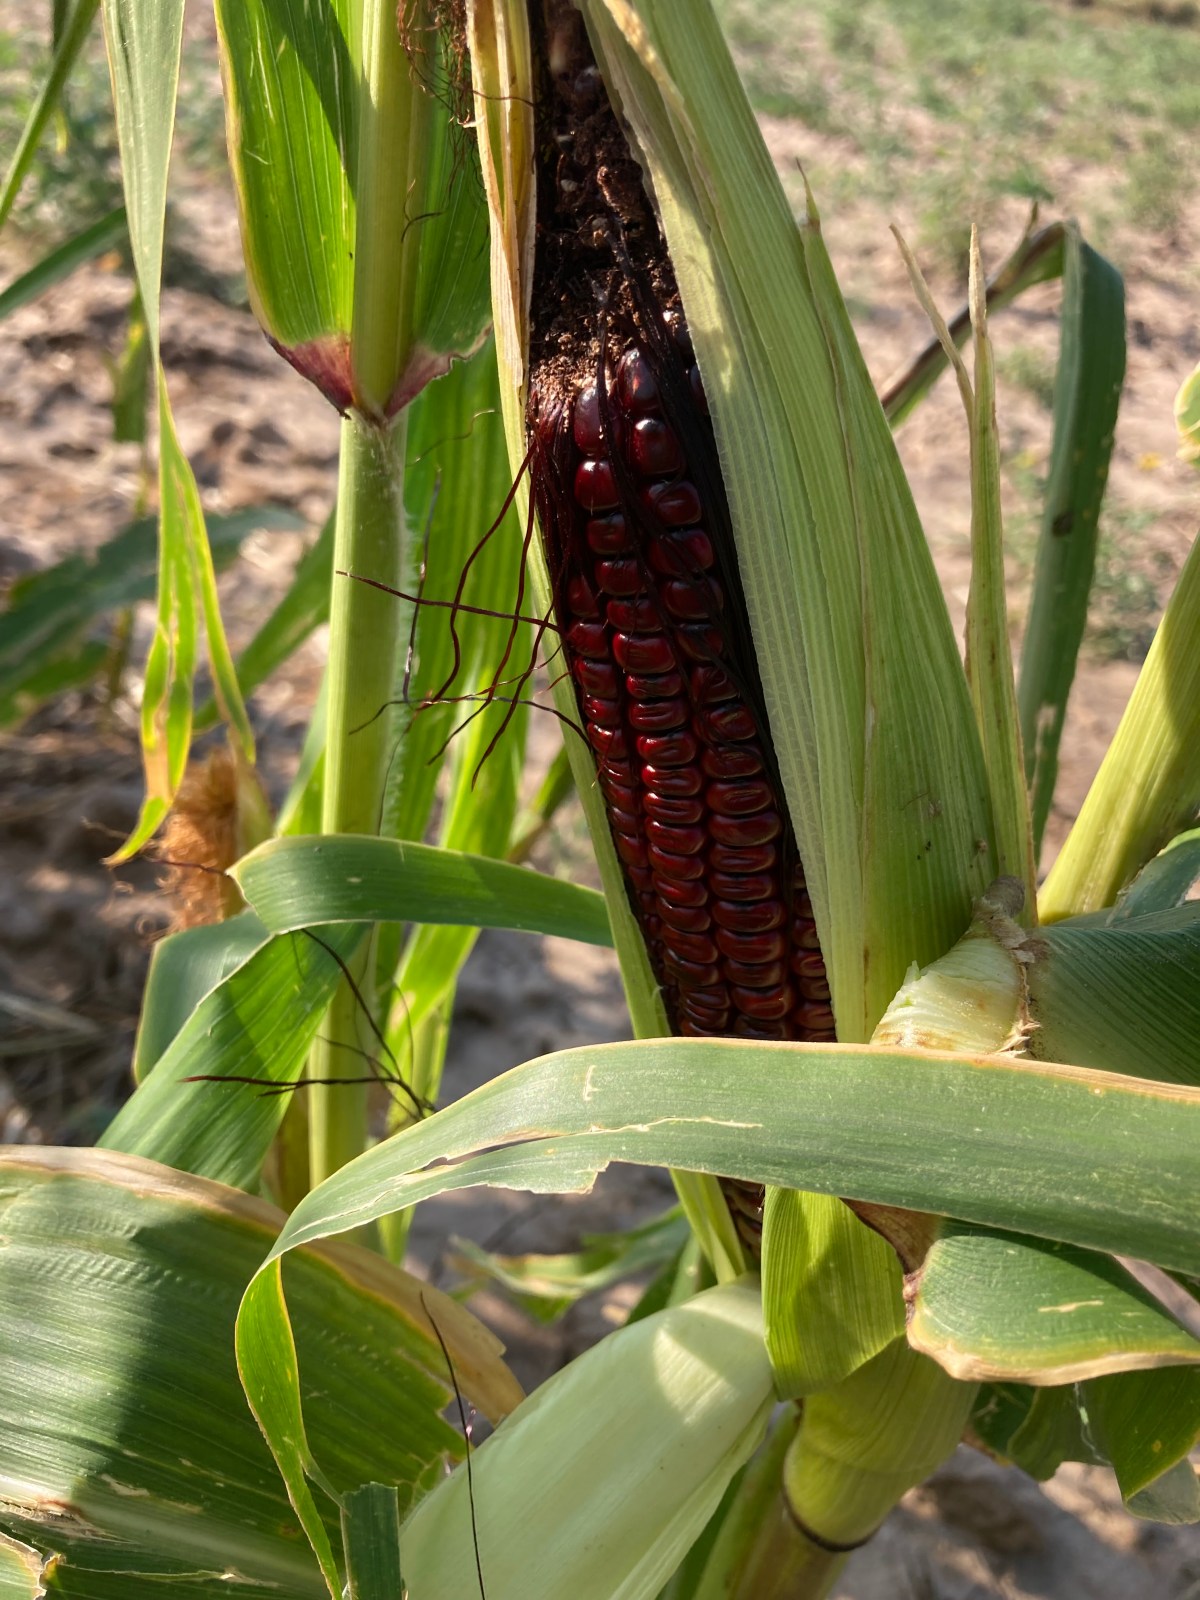
Hi-A Corn Variety Plots at the Halfway Research Station
Field Tours and Research Highlights
The day began with a welcome from Dr. Todd Baughman, followed by an introduction from Dr. Wenwei Xu, Regents Fellow and corn breeder at Texas A&M AgriLife Research in Lubbock.
Dr. Xu has led the development of Hi-A corn varieties, including TAMZ 102, which is known for its deep purple kernels and high anthocyanin content. His work has focused on combining yield performance with enhanced nutritional traits, creating hybrids that perform well in the field while offering health-promoting properties. The Hi-A program under Dr. Xu’s leadership has become a cornerstone of innovation for Texas A&M AgriLife, linking plant breeding with food and health research.
Participants then toured Hi-A corn plots at the Halfway Research Center before traveling to Helms Farms to view large field-scale strip trials. These demonstrations highlighted how Hi-A and short-season hybrids are performing under West Texas growing conditions. Mr. Ken Igo, Halfway Farm Chemicals discussed on-farm performance results at the Edmonson location.

Hi-A Corn Varieties at the Helms Farm. Dr Xu is discussing the variety performance.
The tour then returned to the Halfway Research Center where Dr. Tim Paape (USDA-ARS) provided updates on breeding, genetics, genomics, and metabolism research. Tim Paape is a Research Geneticist with the United States Department of Agriculture (USDA), who works in the areas of plant and crop genetics, genomics, and molecular biology. He is directly employed with the USDA-ARS Responsive Agriculture Food Systems Research Unit (RAFSRU) located on the Texas A&M College Station campus.
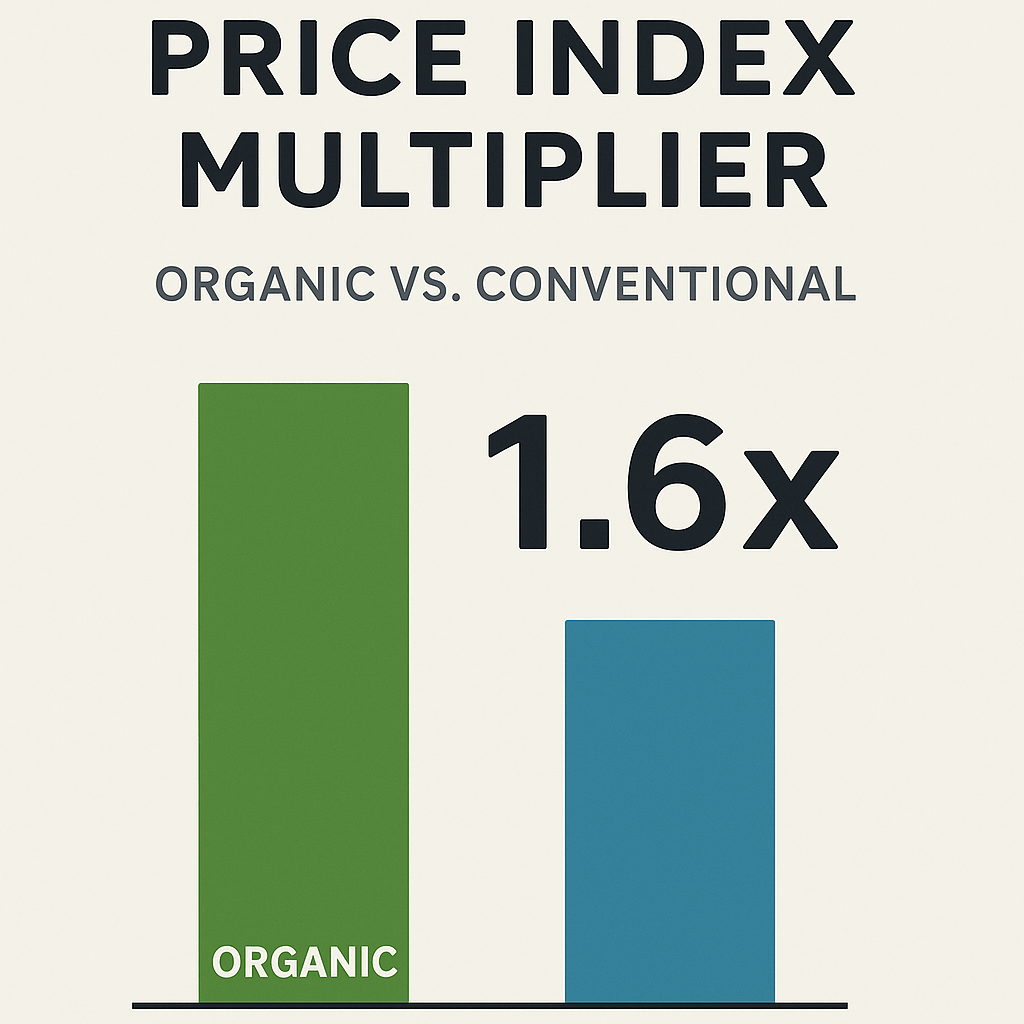
After Dr. Paape spoke, I was able to share about the opportunities for organic corn in Texas, focusing on how Hi-A varieties can align with organic markets where consumer demand for nutritionally dense and colorful grains continues to grow.

Dr. Tim Paape introducing Hi-A Corn to HHS Secretary Kennedy when the Secretary visited the TAMU Campus in early July.
Joe Longoria, president of CASA RICA Tortillas in Plainview, shared his experience using this corn in commercial tortilla production, noting its excellent qualities for both flavor and nutrition. Joe is committed to the healthy food movement and talked about his interest in continuing to showcase healthy grains in his products.
From Research to Food
One of the highlights of the day was the luncheon, where participants tasted enchiladas, chips, and tortillas all made with Hi-A corn. The deep color and flavor of these products come from naturally high anthocyanin content in TAMZ 102. A big thanks to Joe Longoria and Casa Rica for providing the Hi-A chips and tortillas. Amazingly there were no chips or tortillas left after lunch!!
This hands-on experience helped bridge the gap between the research plots and the food plate, showing how agricultural innovation can quickly translate into consumer products.
Building Toward the Future
The classroom event did conclude with an informal Research Forum, where scientists, producers, and industry leaders discussed strategies for integrating breeding, production, and commercialization of Hi-A corn. By combining genetics research with market development, this crop has potential not only in specialty food markets but also in animal nutrition.
A Shared Success
The Field Day was a success thanks to the collaboration of researchers, growers, and industry leaders. With Hi-A corn gaining momentum, it’s encouraging to see strong partnerships forming around this crop. The tortillas, chips, and fresh ears we shared at lunch gave everyone a taste of what the future of corn could look like—nutrient-rich, flavorful, and farmer-driven.
Big thanks and a great deal of appreciation to the Texas Corn Producers Board, Southern SARE, High Plains Underground Water Conservation District, and USDA-ARS. These outstanding groups not only helped fund this important work but attended the field day as well!