- Soil Formation Starts When Life Colonizes Minerals
- Biological Weathering Is Faster Than Purely Geological Weathering
- Organic Matter and Clay Create Nutrient-Holding Capacity
- Aggregation: The “Soil Structure” Breakthrough
- Why Decadal Soil Development Is Plausible
- What This Means for Organic and Regenerative Production
- Bottom Line
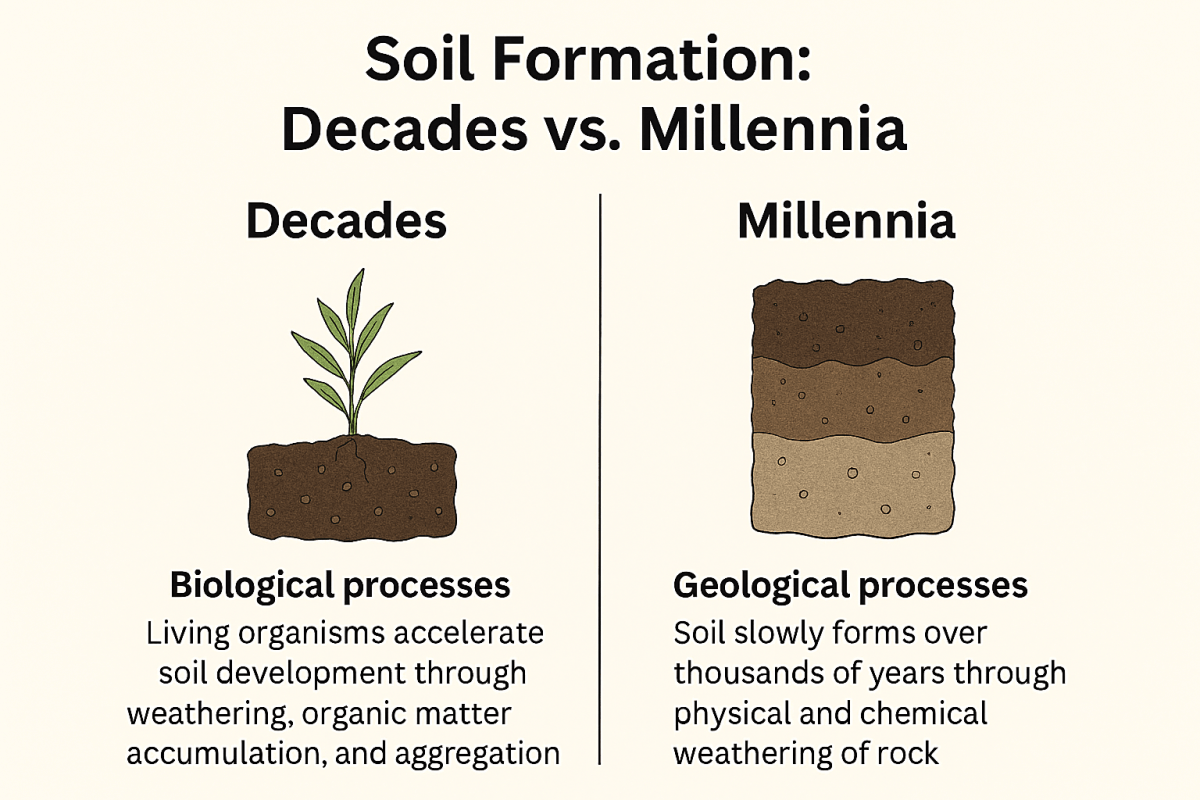
Most of us grew up hearing that “soil takes thousands of years to form.” That statement is still true for deep, fully developed soils with strong horizon development. But what I’ve come to appreciate more and more—especially when working with organic and regenerative growers—is that the early stages of soil formation can move much faster than we were taught.
In the right conditions, soil can develop measurable structure and function on a decadal timeline (2-3 decades). The key reason is simple: biology accelerates soil formation.
Soil Formation Starts When Life Colonizes Minerals
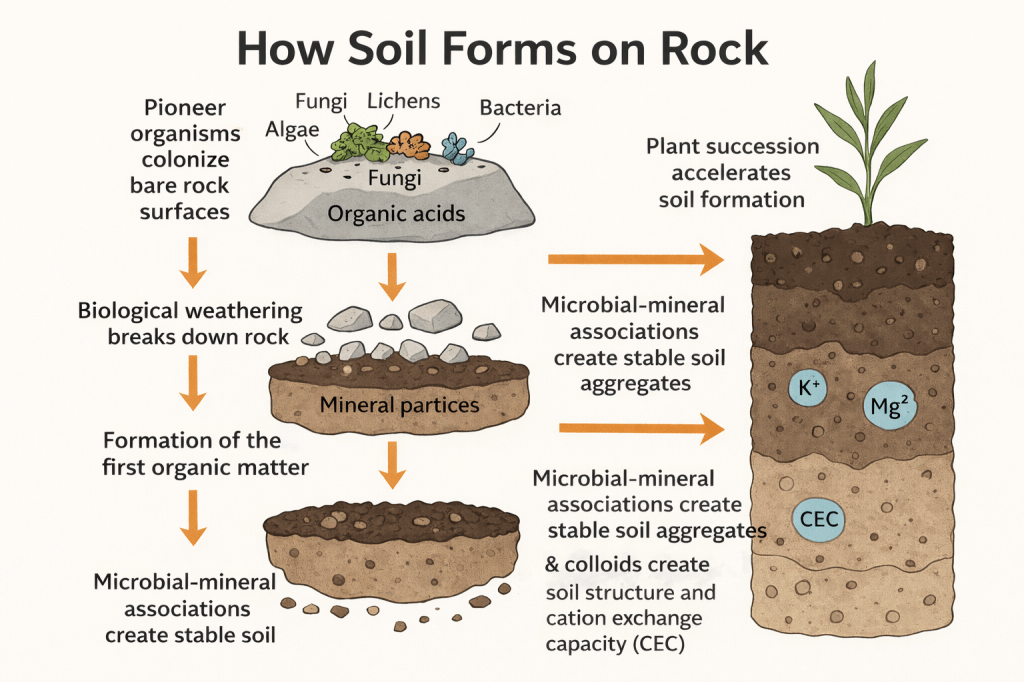
Pedogenesis (soil formation) begins when organisms colonize bare mineral material—rock, ash, subsoil, or exposed parent material. The first colonizers are “pioneer organisms” that can survive with very little water and almost no nutrients. These include:
- Lichens (fungus + algae/cyanobacteria partnerships)
- Cyanobacteria and algae
- Fungi
- Mineral-weathering bacteria
These organisms don’t just “live on rock.” They actively change it. They attach to mineral surfaces, grow into microcracks, and begin chemically and physically transforming the material into something more soil-like.1
Biological Weathering Is Faster Than Purely Geological Weathering
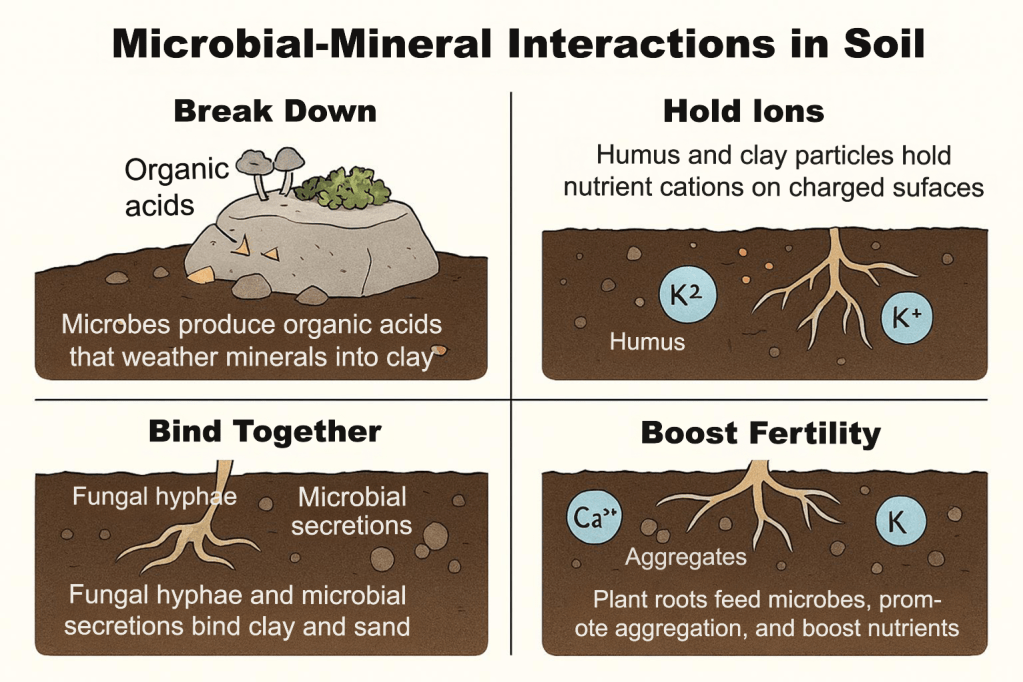
Once microbes and fungi are present, weathering becomes a biological–geochemical process.
Chemical weathering
Organisms produce compounds such as organic acids and chelators that dissolve minerals and release nutrients like:
- calcium (Ca²⁺)
- magnesium (Mg²⁺)
- potassium (K⁺)
- phosphorus (PO₄³⁻)
Carbon dioxide from respiration also forms carbonic acid in water, which further increases mineral dissolution. These acids powerfully dissolve parent material.
Physical weathering
Fungal hyphae and plant roots widen cracks. Wet–dry cycles and freeze–thaw cycles fracture material. Windblown dust can add fine mineral particles. The result is more surface area and faster breakdown.
In short, biology makes the parent material more reactive and easier to transform.
Organic Matter and Clay Create Nutrient-Holding Capacity
As the pioneer organisms mentioned above die and recycle, organic residues accumulate. Even small organic inputs matter (adding compost/grow cover crop) because they start forming organo-mineral associations—the foundation of stable soil.
At the same time, primary minerals weather into secondary minerals (including clays and short-range-order minerals, depending on parent material). Both clays and humified organic matter carry negative charge, which contributes to:
CEC (cation exchange capacity) — the soil’s ability to hold and supply nutrient cations like Ca²⁺, Mg²⁺, K⁺, and NH₄⁺.
This is a major transition point: the soil begins to function as a nutrient reservoir rather than a leaching-prone mineral surface.
A good example of rapid stabilization and soil development occurs in volcanic ash materials, which are highly reactive and can form strong mineral–organic associations relatively quickly.2
Aggregation: The “Soil Structure” Breakthrough
One of the clearest signs that soil is forming rapidly is the development of aggregation—stable crumbs and clods that resist slaking and erosion.
Aggregation is built biologically through:
- fungal hyphae physically binding particles
- microbial extracellular polymers (EPS) acting as glue
- root exudates stimulating microbial activity
As aggregation increases, the soil improves in:
- water infiltration
- pore space and aeration
- erosion resistance
- root penetration
- drought resilience
This is why many growers can “feel” soil improvement within a few years when biological activity is high.
Why Decadal Soil Development Is Plausible
Traditional statements about soil taking thousands of years usually refer to fully developed soil profiles under slow geologic weathering. But modern evidence supports that early soil formation can proceed rapidly when:
- biological activity is high
- parent material is reactive
- vegetation establishes quickly
- erosion is controlled
- carbon inputs are consistent
So, time matters, but biology often controls the rate—especially in early pedogenesis.3
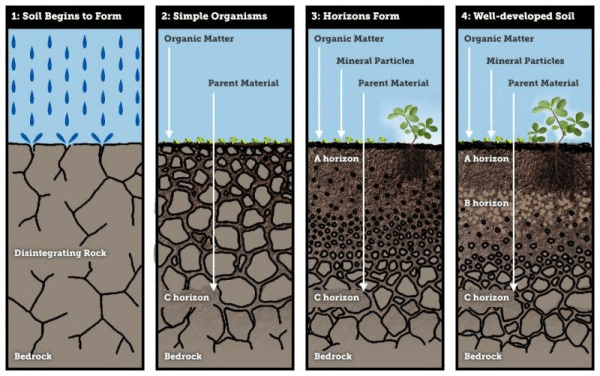
Picture: Manaaki Whenua – Landcare Research 2020. The New Zealand Soils Portal. https://doi.org/10.26060/3nyh-mh28
What This Means for Organic and Regenerative Production
Organic and regenerative systems often accelerate soil development because they intentionally support the same drivers that build soil in nature:
- living roots longer during the year (cover crops, perennials)
- high biomass carbon inputs (residue retention, mulches)
- reduced disturbance where possible
- organic amendments that stimulate microbial activity
When we manage for biology, we aren’t “creating soil out of thin air.” But we are increasing the processes that build soil structure, nutrient retention, and resilience faster than many people expect.
Bottom Line
Soil formation is not just slow geology. It is an active biological process. Under the right conditions, the early stages of pedogenesis—weathering, organic matter accumulation, clay development, and aggregation—can produce measurable improvements in soil function within decades, and sometimes even sooner.
That’s encouraging science for anyone trying to rebuild soil health on real farms in real time.
References
- Soil formation overview: https://en.wikipedia.org/wiki/Soil_formation ↩︎
- Volcanic ash soils and rapid stabilization: https://www.mdpi.com/2071-1050/11/11/3072 ↩︎
- Soil formation factors (Landcare Research NZ): https://soils.landcareresearch.co.nz/topics/understanding-soils/how-do-soils-form ↩︎