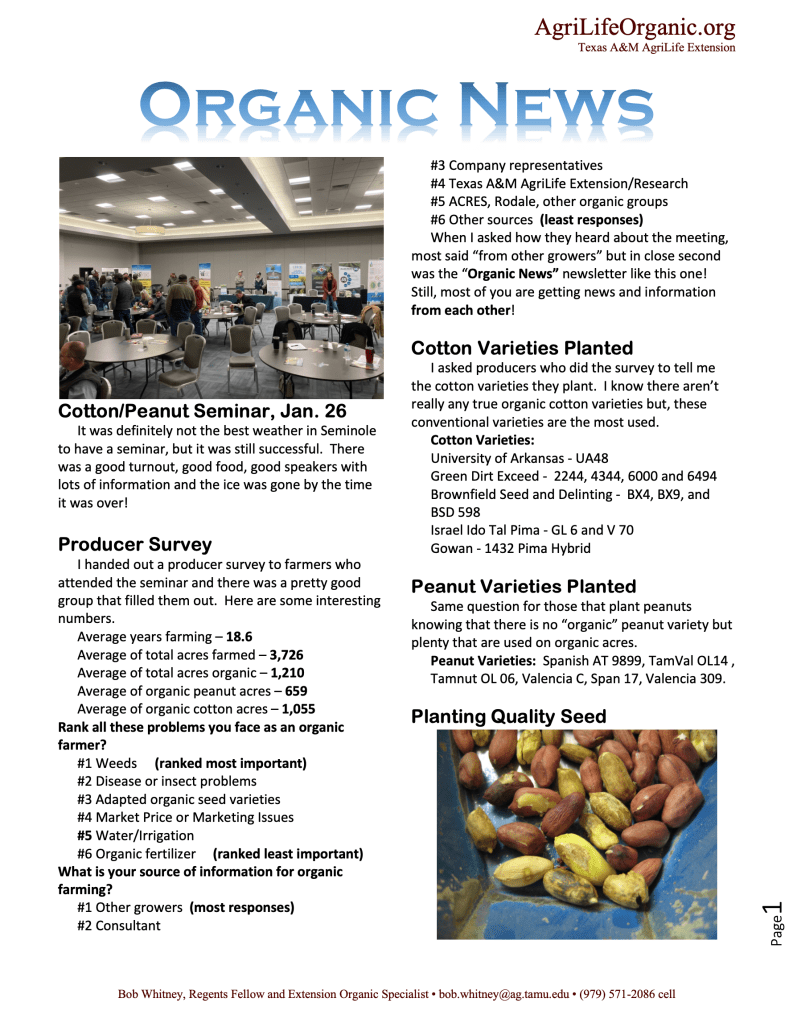
Blog Posts

Survey of Organic Producers

At the Organic Cotton and Peanut meeting in Seminole I asked producers to fill out a quick survey of their production. It was anonymous and the information is very valuable as we plan organic programs. Here are the results:

Average years farming – 18.6
Average of total acres farmed – 3,726
Average of total acres organic – 1,210
Average of organic peanut acres – 659
Average of organic cotton acres – 1,055

Rank all these problems you face as an organic  farmer?

#1 Weeds    (ranked most important)
#2 Disease or insect problems
#3 Adapted organic seed varieties
#4 Market Price or Marketing Issues
#5 Water/Irrigation
#6 Organic fertilizer  (ranked least important)

What is your source of information for organic farming?

#1 Other growers  (most responses)
#2 Consultants
#3 Company representatives
#4 Texas A&M AgriLife Extension/Research
#5 ACRES, Rodale, other organic groups
#6 Other sources  (least responses)

            When I asked the question how growers heard about the meeting, most said “from other growers” but in close second was the “Organic News” newsletter like the one sent out every other month. Still, most growers are getting news and information from each other!

Cotton Varieties Planted. I asked producers who did the survey to tell me the cotton varieties they plant.  I know there aren’t really any true organic cotton varieties but, these conventional varieties are the most used.

Cotton Varieties: University of Arkansas – UA48, Green Dirt Exceed –  2244, 4344, 6000 and 6494, Brownfield Seed and Delinting –  BX4, BX9, and BSD 598, Israel Ido Tal Pima – GL 6 and V 70, Gowan – 1432 Pima Hybrid

Peanut Varieties Planted. Same question for those that plant peanuts knowing that there is no “organic” peanut variety but plenty that are used on organic acres.

Peanut Varieties:  Spanish AT 9899, TamVal OL14 , Tamnut OL 06, Valencia C, Span 17, Valencia 309.

Check out the latest newsletter!

Click on the picture to see the actual newsletter

Here is the latest newsletter mailed to folks interested or involved in organic agriculture. Yes, I still mail out newsletters you can hold in your hand!

To see the newsletter just click on the picture above and it will take you to a pdf you can either read or download and print.

Lots of good information and as always I welcome your comments and suggestions.

Corn and Sorghum Grower Meeting

If you farm in the Northwest Panhandle of Texas here is a great opportunity to get both conventional and organic corn and sorghum grain or silage production information.

I will be discussing organic corn and sorghum production, integrated pest management techniques and strategies for organic pest control, soil health and fertility related to organic crop production and a good emphasis on organic weed control. I will also discuss cover crops, rotations and equipment for organic weed control. This will be an in-depth look at the types of cultivators and timing for good control of weeds in an organic system. Should be fun!

Does soil management affect soil health?

An extensive research project conducted in Sweden shows it does….

There is a huge amount of research work done and a significant portion is so specific that you can’t make application to anything in the real world. On the other side there is research that is so broad and almost meaningless that there is no way to apply it in the real world.

The title of this research is, “The influence of soil management on soil health: An on-farm study in southern Sweden.”1 I like this study because it took a look at the relationship between a soil management index (SMI) they developed for the research and soil health indicators that were developed at Cornell called the CASH (Comprehensive Assessment of Soil Health) protocol. This CASH system looks at the physical, biological and chemical properties of a soil to develop an overall quality score. The Haney soil test does the same sort of thing.

The soil management index (SMI) for the over 20 farms in the study was developed by (1) quantifying the crop diversity, (2) the frequency of soil disturbance and the (3) number of applications of external organic amendments (manure). These 3 items would make up the SMI score and then they compared that to the soil health indicators for those particular farms. Clear as mud? Don’t worry because what matters are the results!

What are the results?

  • Soil management significantly affected all measured soil health indicators.
  • Fields with a higher soil management index (SMI) showed better soil health.
  • Soil health of farm fields was generally poorer in comparison with unmanaged soil. Unmanaged soil was a forest area or good pasture area.
  • The ratio of soil health of farmed to unmanaged soil increased with increasing SMI. (This is important!)

So, what they found was that all the soil health measures got better the higher the SMI number was. Generally, this would make sense and be what we would expect. What I was surprised by was that there were two soil health indices that were strongly influenced by the soil management – wet aggregate stability and extractable soil protein (organically bound nitrogen available to microbes). Soil texture seemed to have more effect on these other three soil health indicators – active carbon, soil respiration and soil organic matter. Soil management did have an effect on these three, but texture had a stronger effect.

Wet aggregate stability is a measure of how well the soil stays together in a rainfall simulation. Aggregate stability means the soil is stable, held together but all kinds of things, one of which is the glue our microbes supply if they are active. Good soil aggregation means less compaction, room for water movement and root growth. Second, the extractable soil protein is a measure of the food available to those microbes. I think it makes sense that a high SMI would mean a high Soil Health Score! Wouldn’t you expect that to happen if you reduce tillage, add in cover crops or change up your crop diversity and add soil organic amendments?

Lastly, there is some thought that a tool like SMI, properly developed, could be a way to know if we are increasing soil health. This research analysis is showing they are highly correlated and that is a good thing. Also, it might be a way to measure and pay for potential carbon sequestration because a healthy soil does sequester carbon.

  1. Hanna Williams, Tino Colombi, and Thomas Keller, “The influence of soil management on soil health: An on-farm study in southern Sweden,” Geoderma 360 (2020): 114010, https://doi.org/10.1016/j.geoderma.2019.114010. ↩︎

Time to Soil Test

This is definitely the time to be out in the field soil testing. I am a big proponent for taking your soil samples at the same time every year so that I can reasonably expect that the soil is at the same environmental condition as in previous years. I also like to keep my soil test results in a spreadsheet where I can place them side by side and see every year’s results. How can I monitor fertility unless I measure fertility? How can I know progress unless I can see the changes from year on top of year? Here are some test results I like to see.

Types of Soil Tests

Of course, a normal soil test or what you might call a Regular Soil Test is a must. These are not usually expensive, +/- $15 or more with micronutrients. This test is mostly meaningless unless I have previous year’s results to see what is going on. I have taken literally thousands of soil samples and often I will see something show up that is off the charts. I am not known to panic when I see a problem because I am not going to react to that test unless I know it has steadily been a problem that is just getting worse. For instance, we can see pH swings in sand from one year to the next. Before I lime a soil, I may take a second sample just to verify I need lime. $15 soil test is cheaper than $60 per acre lime application.

Second, I like to have a Haney Soil Test done. What does a Haney soil test give me? Here is a list of the tests done:

  • Soil Respiration CO2-C ppm
  • WEOC – Water Extractable Organic Carbon
  • WEON – Water Extractable Organic Nitrogen
  • %MAC – % Microbially Active Carbon
  • Organic C:N
  • Organic N to Inorganic N
  • Organic N Release
  • Organic N Reserve
  • Soil Health Score

If you thought it was cheap, guess again. Most labs charge $50 so you don’t usually just send everything in for a Haney Test. Again, the results are only good if you have several years’ worth of data to see if you are getting better.

Last, is the PLFA Test or Phospholipid Fatty Acid Test. This test measures the biomass of the microbes in the soil and is one of the tests that is currently being conducted to determine the microbial population of soil. Here’s an example:

Looking at this example you can see the microbial biomass, the diversity index with a rating chart, the different groups – bacteria, fungi, protozoa and undifferentiated (unknown). This test is not cheap either costing $75 per sample but it does help to know if you are putting in the right mix of crops and fertility to see microbes increasing.

The “take home” message is not soil testing only, but records of soil tests you can see over time!

New in 2022!

I first need to keep myself out of hot water with all the copyright police. This is a picture taken of a page in the American Fruit Grower magazine, February 2022! I like to subscribe to lots of publications and this is just one, but a special one since it has a section called, “Special Coverage Biologicals.”

There are lots of new products coming out this year for use in organic agriculture and it is a good thing. These companies are finding a good market for biologicals and the good market is driving them to research and test new products for the market. This list features soil amendments, fungicides, insecticides, fertilizers and more.

Here is another article I “stole” from Southwest Farm Press which they got from Wallaces Farmer. It is about a new company that has a botanical fungicide from the Soapbark tree in Chile. This new fungicide is not even approved in the US yet but has excellent control of botrytis blight commonly known as gray mold a problem in strawberries and many greenhouse and landscape crops. Syngenta is working with this company to bring products like this to market. The biological/organic world is changing fast!