Modern agriculture is becoming more data-driven—and one of the most powerful, yet underutilized, tools available to producers is the combination of Google Earth and the Web Soil Survey (WSS). By combining satellite imagery with accurate USDA soil maps, we can get a clearer picture of what’s happening below the surface—and make better decisions above ground.
In this post, I’ll show how I use Google Earth to not only view an alfalfa field visually but also overlay the soil types, interpret their characteristics, and use that data to plan irrigation, understand yield variability, and improve management.
Step 1: Start With a Clear Aerial View of the Field
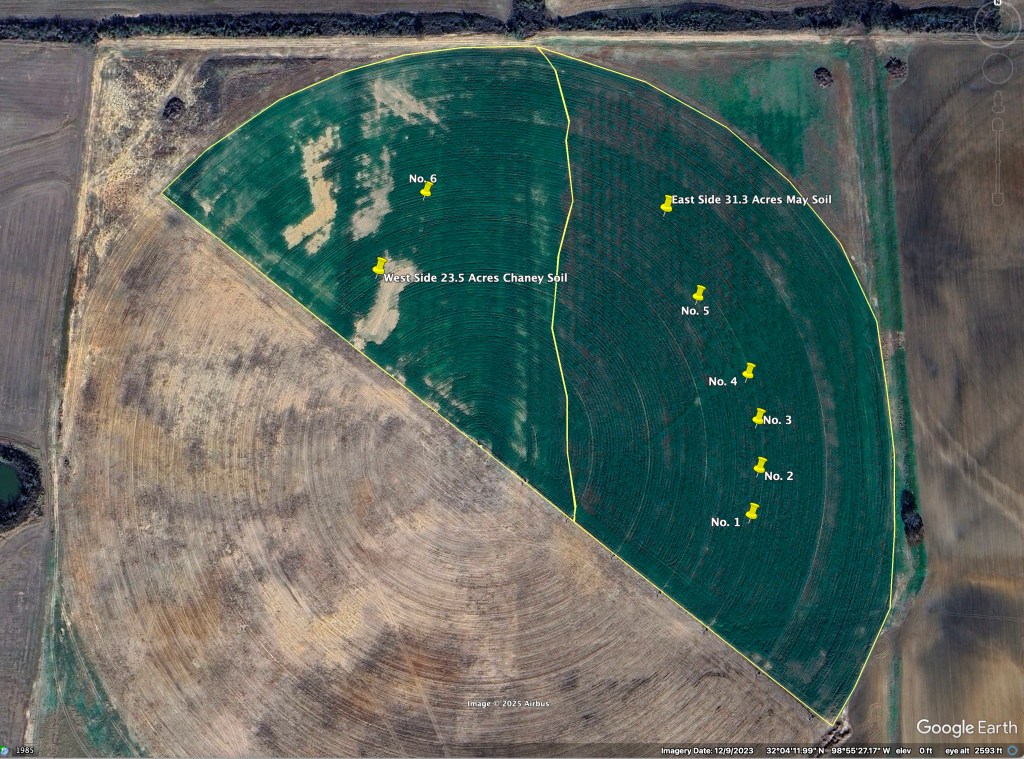
Here I opened Google Earth and zoomed in on our irrigated pivot field that we are studying. This field is part of an irrigation experiment we are conducting to determine alfalfa response to varying irrigation rates. Numbers 1-6 pins on the map represent the sensors buried in the soil and those sensors measure soil moisture to 3 feet deep. You will also notice a jagged yellow line through the field which represents where two soil types are in this field. The east side is a May soil type, and the west side is a Chaney soil type. Google Earth does not typically show soil types – so how did I get these soil types added?
Step 2: Adding a SoilWeb Earth KMZ file

If you will open your browser and go to https://casoilresource.lawr.ucdavis.edu/soilweb-apps you will see the screenshot I have demonstrated in the picture above. For this to work you need to have Google Earth on your computer already but hopefully you have done that by now. Next click on the picture under SoilWeb Earth and your computer will ask you to save a file called SoilWeb KMZ. Save it where you can find it on your computer.
Next open Google Earth and at the top left click on File and then open so you can choose the location of your recently saved KMZ file. When you open this file in Google Earth it will now show all the soil types for any piece of property in the United States. It may take a minute to open all the features. If you scroll down the left menu under Places, you will see the SoilWeb item, and you can check or uncheck to turn it on or off. It will probably be under the temporary file section and you just need to move it up to get it to stay open when you open Google Earth.
Step 3: Investigate the Features
When turned on you will see all the yellow lines that represent differing soil types. If you click inside of a soil type outlined with the yellow lines, you are inside that type.
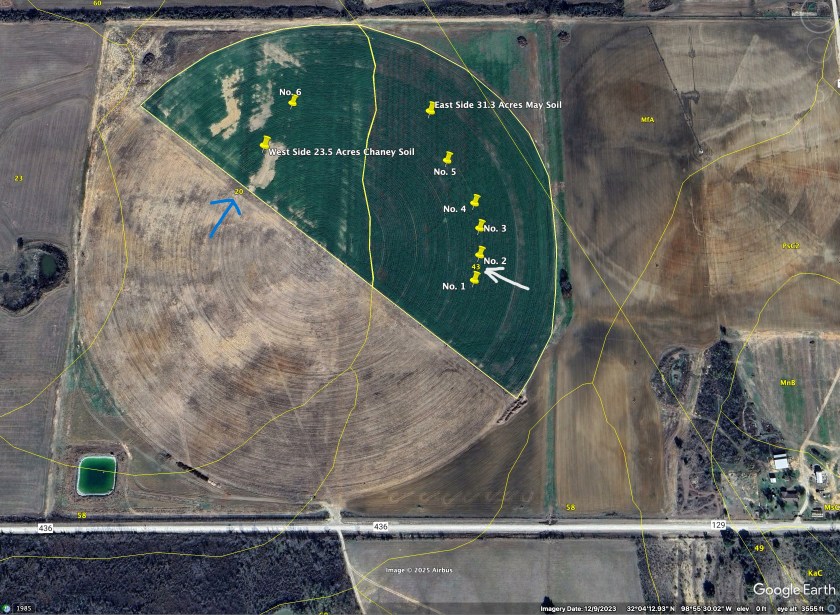
When you click anywhere in that soil area you will see the picture below pop up. This is the pop up when I clicked in that “soils” area in the picture and this shows the soil types represented in this area of the pivot. This area is predominantly a Chaney soil type with a small percentage of the others in this area as well.


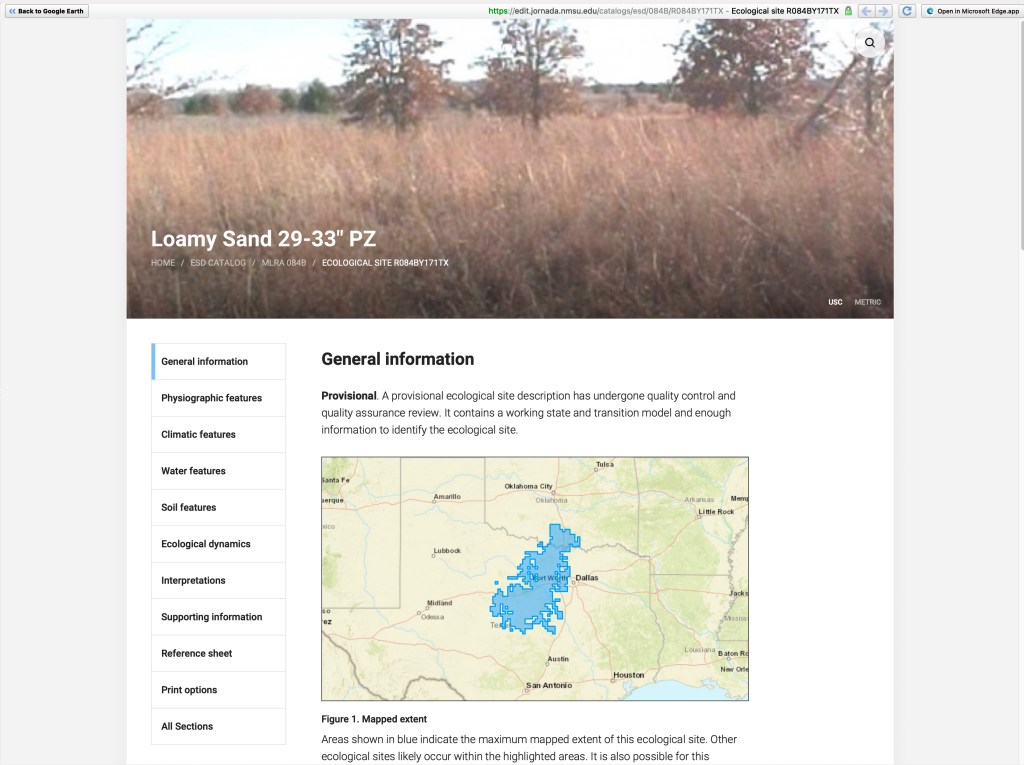
Now if you click on the blue words loamy sand under the title “Chaney” it will pop up the description in the picture below.
When I get this popup, it is displayed in Google Earth, but you can just click on the upper right to get it to appear in your web browser too. On the left of this picture, you see a menu full of information on this Loamy Sand soil type. Play around with it and learn about your soil.
Now lets go back to Google Earth by clicking the button at the top left that says, “Back to Google Earth.” When you do let’s once again click inside the soil type we are interested in and you will see this popup graphic again.
Click inside the colored soil column and you will get a different page pop up.
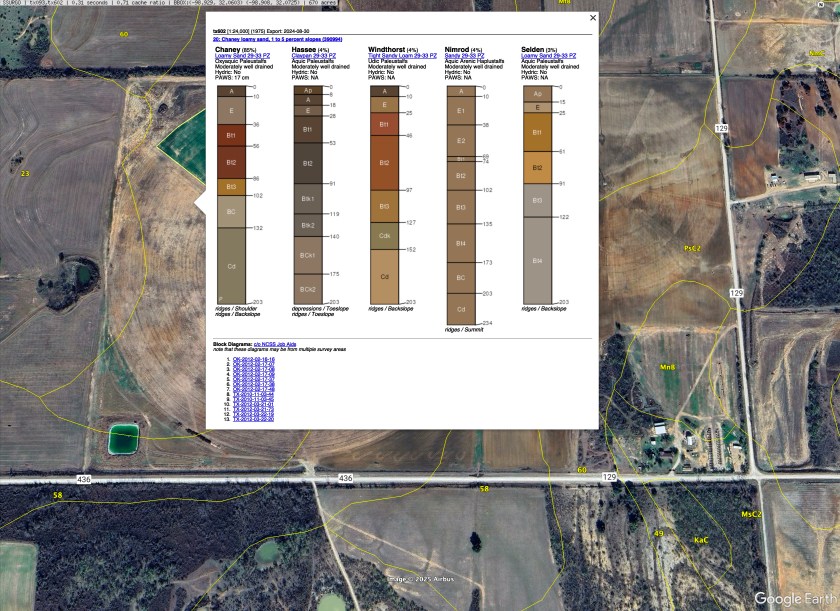
The picture below is a description of the Chaney soil series, and it is very detailed. At the top are different tabs you can click on like lab data, water balance, and more or just scroll down through it! You will spend a lot of time just looking at this one series and your farm could have many different series across your different fields. As you zoom out in Google Earth you will find lots of soil types and experiment by clicking on several and then clicking again in the popup menu of soils in that series. It is interesting and it will help you learn how to get the information you need. Do not be afraid to “click” on something!

In our irrigation study we are interested in the water holding capacity of the soils and you can get that under “water balance.” This graphic below will show the water storage in this soil series based on the month and we quickly see we will run a pretty hefty deficit in July, August and September but an abundance in winter. This corresponds to when the typical vegetation in summer is using the water.

Why do I like this soil series feature?
I am constantly using Google Earth in my work. If I have a call from a producer about crops, soils, irrigation or just about anything else on a producer’s farmland I will pull up the fields in Google Earth. When I do this special feature is automatically available and so I can look at the fields and I can evaluate the soils. I can tell how deep they are for crop growth, what the estimated pH is, soil water holding capacity, organic matter, and even estimated yields on dryland crops. This doesn’t mean that things won’t vary somewhat from the data in Google Earth, but that variation will not be too far off from this excellent information! And it is certainly a great starting place for figuring out any problems in any field before we start.
Discover more from Texas A&M AgriLife Organic
Subscribe to get the latest posts sent to your email.

LikeLike